
What if inflation’s not dead
And set to go higher instead?
Can Fed funds still fall?
Well, that’s a tough call
If not, look for trouble ahead
As we await Tuesday’s latest CPI data, I thought it might be a good time to review how things currently stand on a macro basis. As I am just an FX guy, I am not nearly smart enough to see through the headlines and determine what is wrong with the narrative story of Goldilocks. However, I can look at the actual numbers and perhaps we can draw some conclusions from that data.
Let’s start with CPI, as that is the next shoe to drop. Looking at the last twelve months of monthly data, we see the following results on both an original and adjusted basis:
| CPI m/m | annualized | CPI m/m (adj) | annualized | |
| Dec-23 | 0.3 | 3.6 | 0.2 | 2.4 |
| Nov-23 | 0.2 | 3.0 | 0.2 | 2.4 |
| Oct-23 | 0.1 | 2.4 | 0.1 | 2.0 |
| Sep-23 | 0.4 | 3.0 | 0.4 | 2.7 |
| Aug-23 | 0.5 | 3.6 | 0.5 | 3.36 |
| Jul-23 | 0.2 | 3.4 | 0.2 | 3.2 |
| Jun-23 | 0.2 | 0.2 | ||
| May-23 | 0.1 | 0.1 | ||
| Apr-23 | 0.4 | 0.4 | ||
| Mar-23 | 0.1 | 0.1 | ||
| Feb-23 | 0.4 | 0.4 | ||
| Jan-23 | 0.5 | 0.5 |
Since the January 2024 data hasn’t been released, there would ordinarily be no revision yet. However, as I wrote last week, the BLS does an annual revision which lowered the December 2023 result by a tick.
As you can see that one tick had a big impact on the annualization trend for the past 6 months, and especially the past 3 months (highlighted), reducing it substantially. Now, given the imperfections of the measuring process, 0.1% is probably not significant in the broad scheme of things. But oh boy, for the narrative, it is everything. Prior to that revision, it was pretty easy for those who believe inflation has bottomed to highlight that turn higher in the annualization rate. This was especially true given how much the ‘inflation is dead’ crowd was relying on just that point. But now that turn looks like a dead-cat bounce and is not nearly so impressive. Tuesday’s outcome will be quite interesting as anything that is soft will almost certainly encourage the doves to be calling for a March cut more aggressively, and just as certainly, we will see risk assets rally sharply as the dollar declines. A hot print, though, 0.3 or more, will have the opposite impact.
What if the ‘conomy’s state
Was built by the deficit’s weight?
And actual growth
Ain’t fast, but more sloth
Will Janet, more spending create?
When looking at GDP data and Federal government expenditures, it becomes pretty easy to determine why GDP continues to percolate along so well. Given that GDP = Consumption + Investment + Government + Net eXports (Y = C + I + G + NX), a quick look at the G component shows just how much support the government has been adding to the economy despite what has been recorded as strong growth. Or perhaps, more accurately, this is why growth has been so strong. The below chart shows the trend of government expenditures relative to total GDP growth. I removed the Covid years because they are extremely volatile and confusing. However, looking at the trend since the GFC in 2008/2009, there has been a step change higher in the amount of government activity measured in the economy.
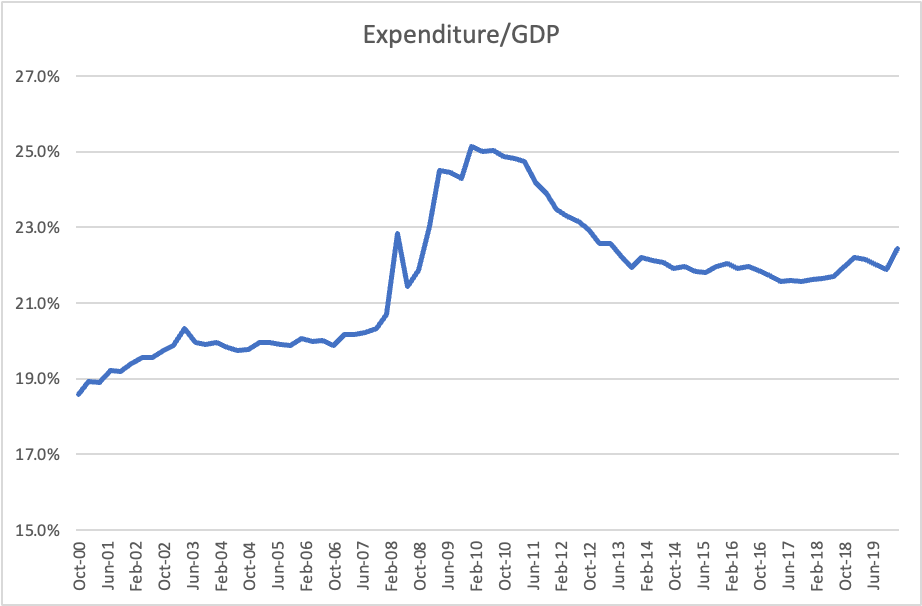
Source: data FRED St Louis Fed, calculations @fx_poet
Given the current budget deficit is running > 7% of GDP and is projected to remain at least this high going forward, it is quite clear that there is a lot of nonorganic effort to raise the GDP measures. Look at the sharp upward turn at the right side of the chart. It appears that the administration will do everything they can to continue to show that the economy is strong.
Of course, this is where the rubber meets the road. If the administration continues to pump more government spending into the economy, can inflation really decline any further? Remember, government spending is almost entirely consumption based, with limited investment at this time. Even the CHIPS Act only created incentives for private companies to invest, it is not government investment per se. The point is, pumping up consumption demand without adding productive capacity is very likely to drive prices higher. And if anything, given this administration’s war on energy markets, they are discouraging investment in critical infrastructure. It is hard to see how this plays out for a Goldilocks outcome. Far more likely, in my view, is that they continue to pump as hard as possible, and prices start moving higher again. Timing is everything in life, and perhaps they can work it out so price hikes are delayed until after the election, but I am skeptical given the vast incompetence this administration has shown in virtually every sphere in which it operates.
What if employment’s a mess
And actually in some distress?
Is JOLTS data real?
And what is the deal
With households, it’s hard to assess
The last big macro area is, of course, the employment situation. We all know that the NFP report was much stronger than expected for January, rising 353K, but also seeing upward revisions of the previous months for the first time in quite a while. In fact, one of the bearish stories had been that the revisions mattered more than the headline data, and if revisions were for the worse, that was indicative of a slowing economy.
Remember, too, that the US employment situation is measured in two ways, via the establishment survey which is a survey of companies’ (both large and small) actual hiring activity and leads to the NFP number, and the household survey, which is a telephone survey of ~60,000 households and asks the question if someone is employed and if not, whether they are looking for work. The Unemployment Rate is calculated from the household survey, so both are clearly critical in assessing the situation on the ground.
The funny thing is that the numbers come across pretty differently when you dig down. While in the long-term, both data series have shown a strong correlation (96% since January 2000), the Household survey is far more volatile and in the past year has been telling a somewhat different story than the establishment survey. Look at this chart below mapping each since the beginning of 2023:

Source: data FRED St Louis Fed, calculations @fx_poet
Doing the math shows that the establishment survey claims that 3.409 million jobs were created while the Household survey comes in at just over half that amount, 1.852 million jobs. Now, in a nation of 330 million people, especially given the expansion of the gig economy and the dramatic changes in employment overall, maybe that is not such a big deal. As well, simply looking at the two lines shows that the Household survey is far more volatile than the Establishment survey. Does this mean we should ignore the household survey, given it seems to have more noise and less signal? The problem with this is the household survey drives the Unemployment Rate, and nobody is willing to ignore that. And these differences beg the question, is the employment situation as rosy as it seems? With the Unemployment rate remaining so low for so long, it certainly appears that there is ample demand for workers. Of course, that also implies that the cost of labor seems unlikely to decline very much and could well increase further and faster. If that is the case, the impact will be seen in the inflation data as well.
Trying to sum things up here, looking at the three critical macro variables, inflation, growth and employment, there is a strong case to be made that the combination of ongoing government support and continued demand for labor into an aging workforce can lead to solid nominal GDP growth with inflation remaining far stickier than many currently anticipate. If that is the situation, all the hopes and dreams of the interest rate doves may be delayed, if not destroyed, as it will be increasingly difficult for the Fed to ease policy into an inflationary environment. Arguably, this is why they are seeking greater confidence that inflation is really dead.
Now, maybe Goldilocks is real, and inflation will continue to decline on its own because…well just because. But I find it hard to look at the data and conclude that lower inflation is our future, at least for any length of time.
Ok, this has gotten much longer than I intended but fortunately, absolutely nothing of note happened overnight in markets. Literally. There has been de minimis movement in stocks, bonds, commodities and currencies, and there is a distinct lack of data to be released today. Tomorrow’s CPI is THE number of the week, so perhaps that will get the juices flowing again and drive some movement. Until then, a quiet day is usually a good one on which to establish hedges.
Good luck
Adf

Pingback: Stanching Their Bleeding | fxpoetry