
Regarding the payroll report
The fear is jobs coming up short
But is that the fear?
Or will traders cheer
As 50bps they will exhort
With clarity at the Fed lacking
Because of Ms Cook’s recent sacking
And markets at highs
It seems to be wise
To hedge some exposure you’re tracking
Another month, another payroll day. It certainly seems that the market has not lost any of its appetite for this particular data point, although one must be impressed with the ongoing rally to continuous record highs in share prices. So, as we get started, let’s look at what expectations are for this morning’s numbers:
| Nonfarm Payrolls | 75K |
| Private Payrolls | 75K |
| Manufacturing Payrolls | -5K |
| Unemployment Rate | 4.3% |
| Average Hourly Earnings | 0.3% (3.7% Y/Y) |
| Average Weekly Hours | 34.3 |
| Participation Rate | 62.1% |
Source: tradingeconomics.com
Yesterday’s ADP Employment number was a bit softer than forecast at 54K with a very slight revision higher to the previous month’s reading. And of course, poor Ms McEntarfer was fired last month after the massive downward revisions to the previous data so as much scrutiny as this number ordinarily receives, it feels like even that has been turned up to 11 this month. If we look at the Initial Claims data for a signal, (or the 4-week average which removes situations where individual states are late to report) it is hard to get excited about a major problem in the labor market as per the below chart from tradingeconomics.com.
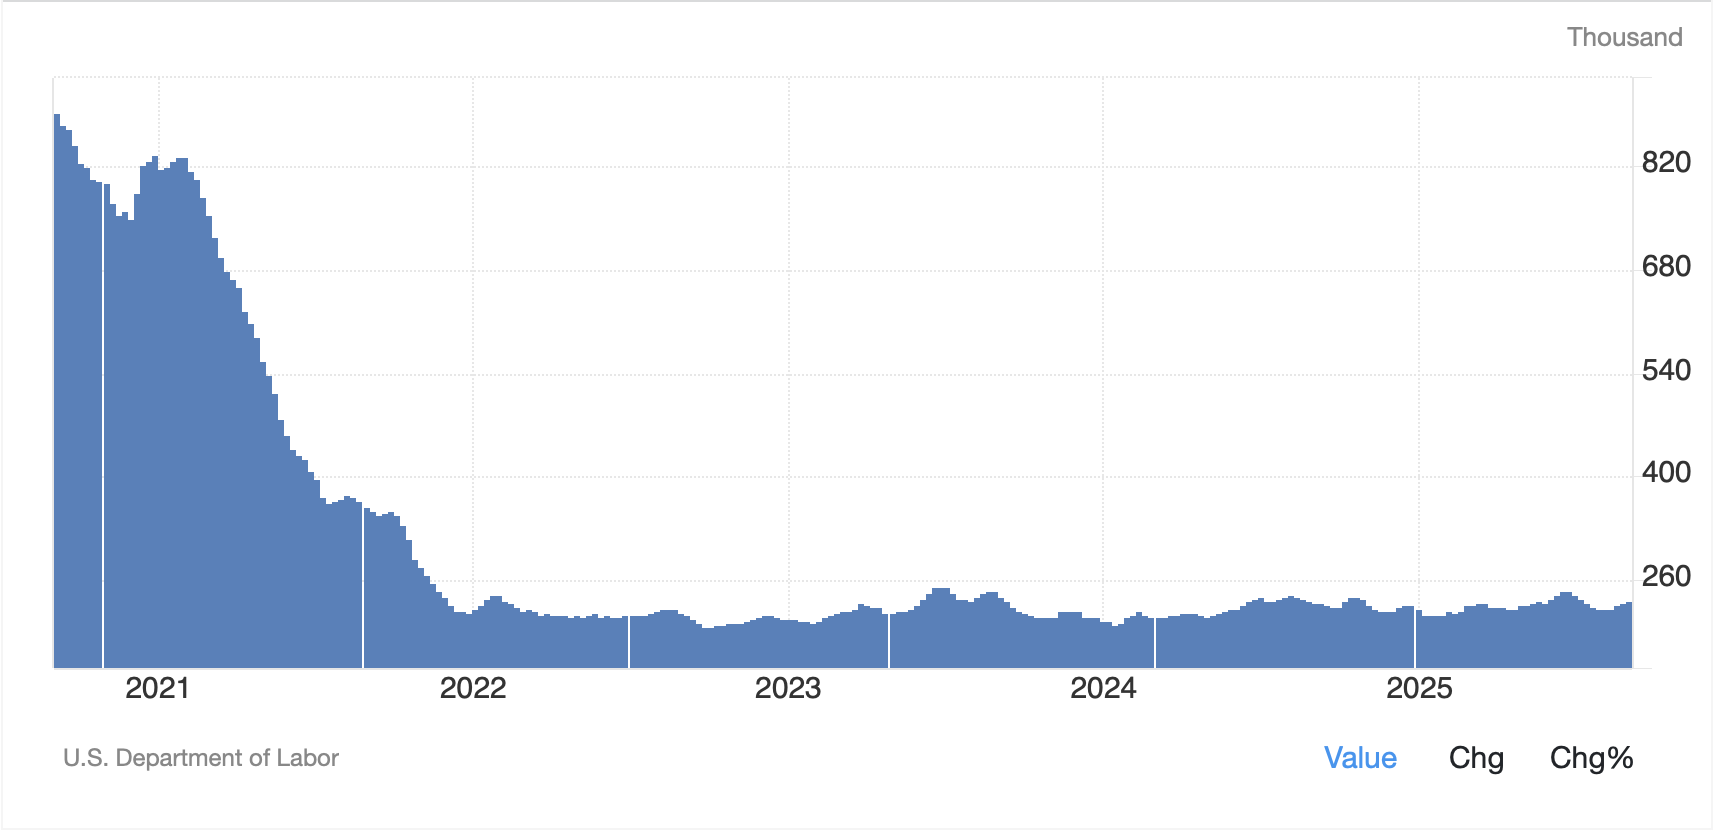
It has pretty much flatlined since the end of the Covid aberration. Even more impressively, the number is low by much longer-term historical standards when the absolute population was smaller, yet Claims data were typically somewhat higher. (I capped the Covid situation so you could get a flavor for the rest of the series). It is hard to look at the last 58 years and describe Initial Claims as pointing to a problem. While I didn’t shade the chart, you can see the recessions in 1970, 1973, 1980, 1982, 1990, 2001, 2008-9 as the periods when Claims peaked. Again, it is difficult to look at this data and conclude a recession is around the corner, at least the traditional definition of one.
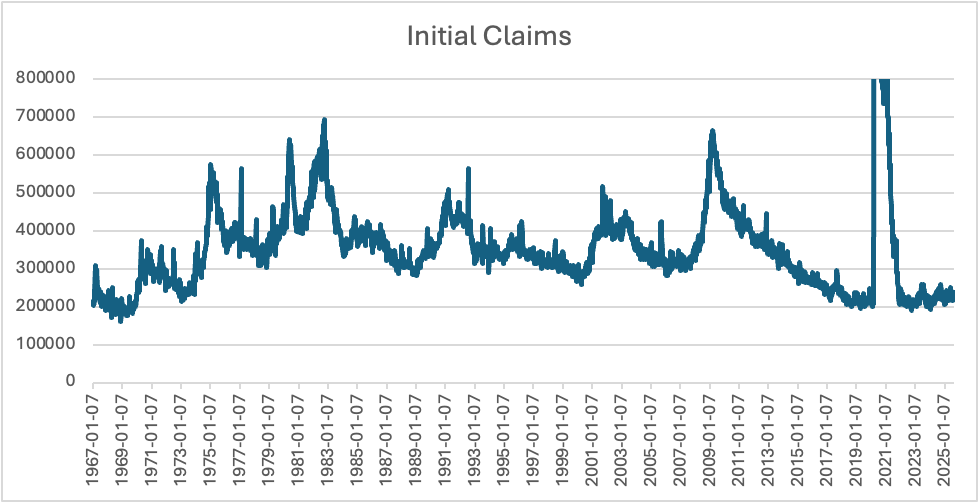
Source: FRED database
Of course, there is a very different vibe these days regarding employment as evidenced by the discussions you see on LinkedIn or even the stories in the WSJ regarding the unwillingness of people to leave a job as they fear finding a new one.
All this is just my way of saying that the asynchronous nature of the economy means we really don’t know what to expect. But we can anticipate market reactions depending on the outcome. FWIW, and remember, I am just a poet:
| NFP | Bonds | Fed funds futures | Stocks | Dollar | Gold |
| >75K | 4.30% | 20bps | -1% | 0.50% | -1% |
| 35K – 75K | 4.15% | 25bps | 0% | 0% | 0% |
| 0K – 35K | 4.10% | 35bps | 1% | -0.5% | 0.20% |
| <0K | 3.95% | 50bps | -1% | -1.50% | 1.50% |
So, there you have it, one man’s guesses as to how the markets will respond depending on the data. In essence, it seems to me that the market has been anticipating enough support to cut rates to protect the economy without assuming the economy is going to crash. That’s why a negative number will be such a problem because that will force a reevaluation of the economic situation and stocks cannot abide a repricing of that risk given the rich valuations. It will demonstrate that the Fed is behind the curve, at least in traders’ minds, and the result will not be pretty. We shall see.
In the meantime, after yesterday’s rally in the US, equity markets around the world are all in the green this morning despite some mediocre data from Europe. But starting with Asia, Japan (+1.0%) had a nice session although China (+2.2%) and Hong Kong (+1.4%) put it to shame. While Japan benefitted from a reduction to 15% on automobile tariffs vs. Japanese cars, Chinese shares jumped on word from the PBOC that they would inject CNY1 trillion into the system and reduced fears of efforts to hold back the rally. Elsewhere in the region, other than India, which was unchanged on the day, everything else was nicely higher following the main exchanges’ leads. As to Europe, while all the bourses are higher, the gains are de minimis, on the order of 0.1% or so, with traders caught between hopes of a US rally and ongoing meh data at home.
In the bond markets, Treasury yields are down to 4.15%, lower by -1bp today, but as you can see from the chart below, down 15bps this week as anticipation of either soft data or 50bps, I’m not sure which, builds.
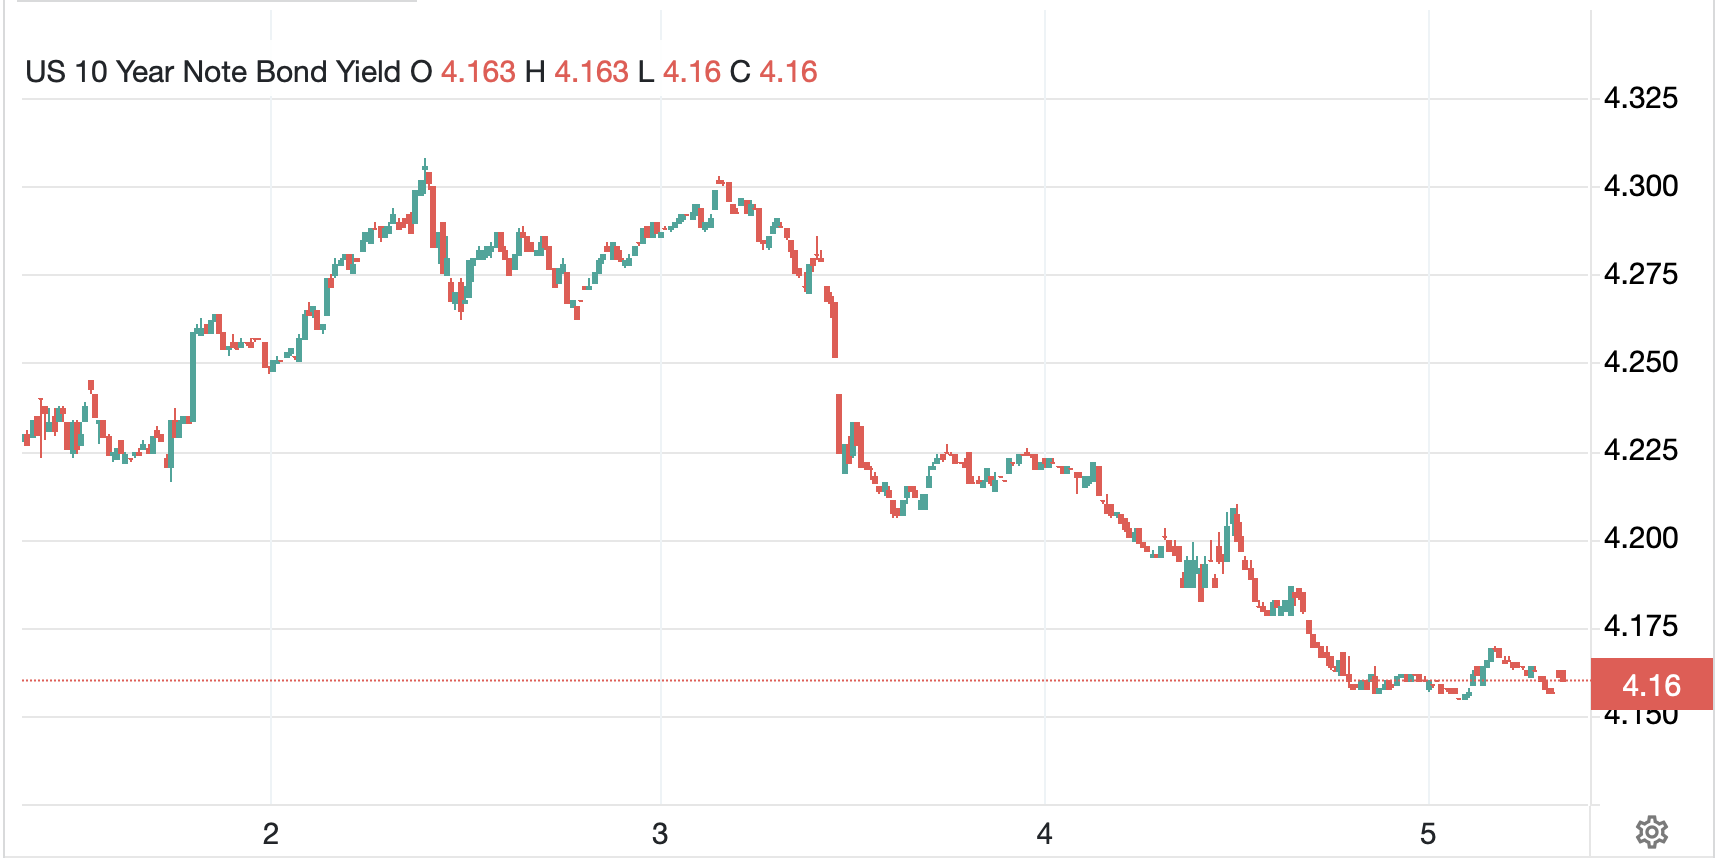
Source: tradingeconomics.com
In Europe, sovereign yields are all lower by -2bps this morning and we saw the same price behavior overnight in Asia with JGB’s and Australian bond yields slipping as well. Maybe inflation is dead! (just kidding)
In the commodity markets, oil (-0.7%) continues to slide and has given back all the gains that accrued based on the idea that OPEC+ was going to cut production further. Gold (+0.1%) continues to find support and drag silver and copper along for the ride as the yellow stuff sits at new historic highs.
Finally, the dollar is softer this morning, down about 0.2% to 0.3% vs. the G10 with similar declines across most of the EMG bloc. I have a feeling this is the market that is anticipating a weak NFP print and a more aggressive Fed come the meeting in two weeks. Futures, right now, are pointing to a 99% probability of a 25bp cut and a 55% probability of another cut in October. Any weak print this morning is going to really show up here, as I explained above.
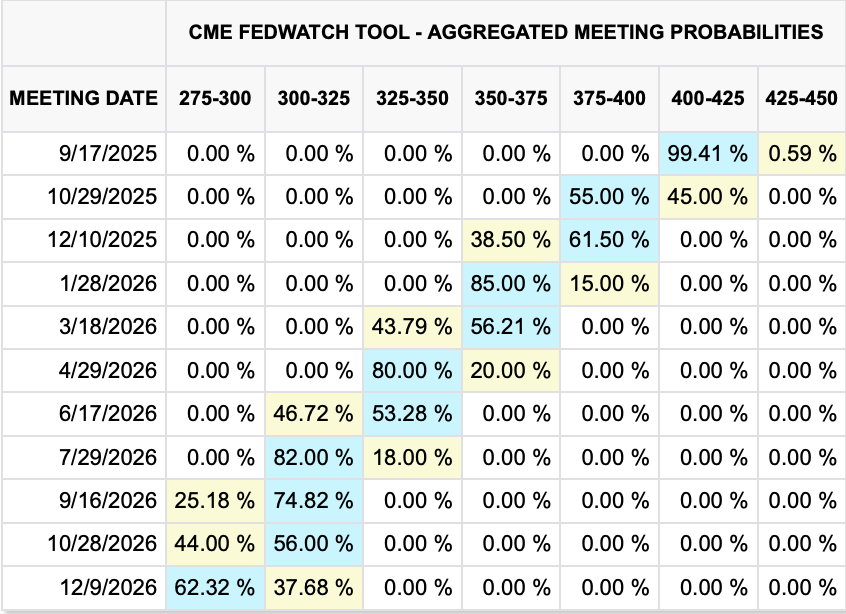
Source: cmegroup.com
And that’s what we have. There are no Fed speakers lined up, and after today, the Fed enters its quiet period, so we won’t hear anything until the meeting on the 17th. NFP will set the tone, so until then, all we can do is wait.
Good luck and good weekend
Adf
