He Axed Her

The NFP data was weak
And President Trump did critique
The BLS head
But unlike the Fed
He axed her as pundits did freak


However, it is a fair question to ask if she was incompetent or politically motivated in her daily activities.  After all, it is abundantly clear there are many government workers who are ostensibly non-partisan who are, in fact, highly partisan.  As such, I took a look at the seasonally adjusted NFP data (the non-seasonally adjusted data is wildly volatile) to see if we could discern a pattern.  I created the chart below from BLS data on revisions with May 2025, the latest month with the normal two revisions, on the left and January 2007, prior to the GFC, all the way on the right.

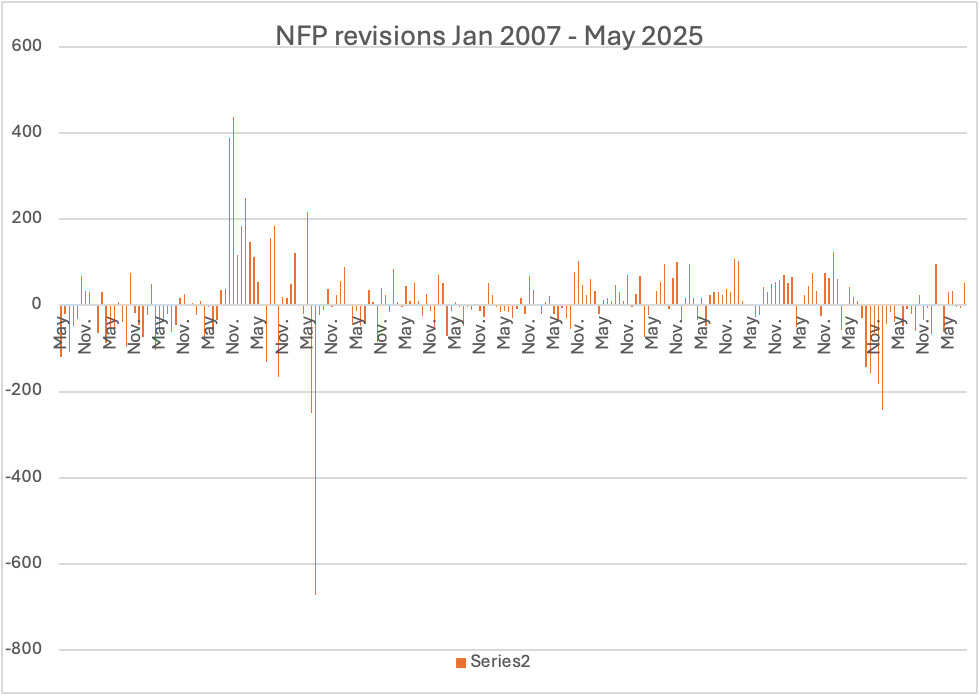
If you look on the left side of the chart, you can see a great many negative revisions.  In fact, 21 of the last 29 months were revised lower from the original print.  If we assume that the BLS models are unbiased, then one would expect a roughly equal distribution of both positive and negative revisions over time.  It turns out, under the unbiased assumption, the probability of 21 out of 29 negative revisions is a very tiny 0.80%.

What conclusions can we draw from this?  My first thought is that the BLS models are not very effective at modeling reality.  I have raised this point many times in the past, the idea that the models that worked in the past, certainly pre-Covid, have been having trouble.  This begs the question as to why an economist of Ms McEntarfer’s long experience didn’t seek to develop a more accurate model.  As it is, there is no evidence that she did so.  I imagine as a government employee, the idea that one should change something that exists within the government framework is quite alien.  Thus, her competence could certainly be called into question, I think.

If we consider the alternative, that her actions were politically motivated, that will be more difficult to discern.  However, given the predominance of Democrat voting members of the federal government and given the fact she was appointed to this position by President Biden, it is fair to assume she is not in favor of the current administration, at the very least.  Now, during Mr Biden’s term, the initial NFP data was consistently better than expected, thus giving the impression that the economy was stronger than it may have otherwise been.  After all, stories about revised data are usually on page 12 of the paper, not headline news.  It is, therefore, possible that she was putting her proverbial thumb on the scale to flatter Biden’s economic performance.  As to her likely distaste of Mr Trump, I expect that to the extent she had the ability to do so, weaker headlines and large negative revisions would be exactly her contribution.

However, the political issue is largely speculation on my part, although I would argue it is plausible.  On the other hand, there is nothing in her background to suggest she is an especially thoughtful or creative economist and there is no indication that she examined the models she oversaw for flaws.  In the end, I come down on incompetence driving a political motive.  But I doubt we will ever know.  

Now, it is not a very good look for a leader to proverbially kill the messenger, which is essentially what Trump did.  Not surprisingly, much hair is on fire in the press and punditry, not because they though McEntarfer was particularly good at her job (I’m sure nobody had ever heard of her before) but because, as we have observed time and again, President Trump doesn’t follow their rules, and they don’t know what to do about it. 

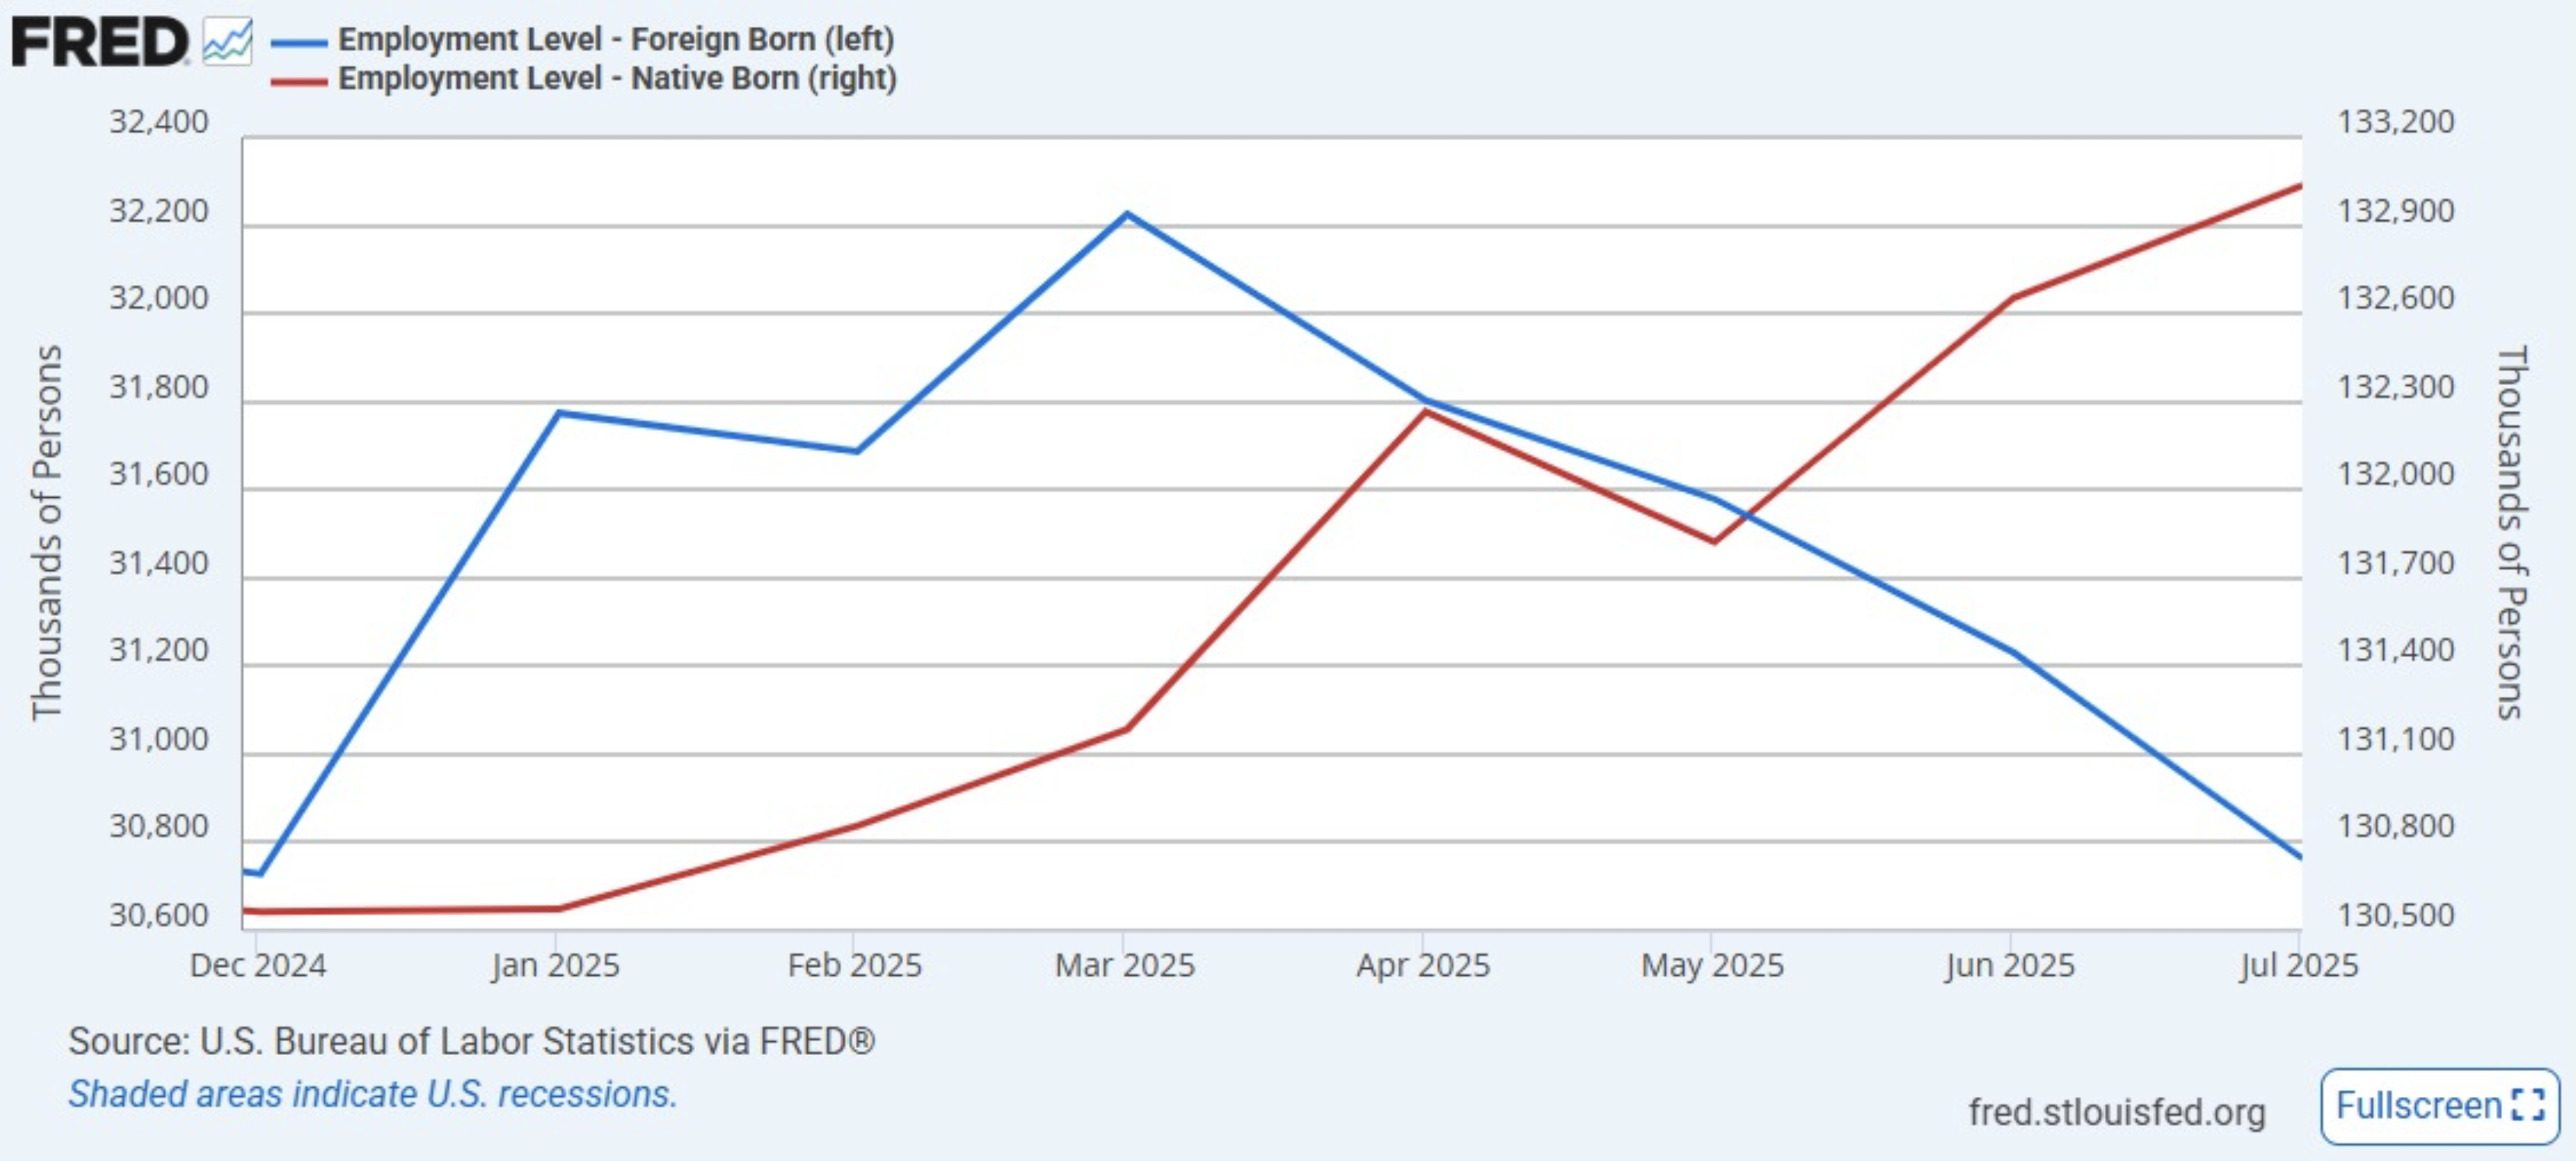
Will this matter in the end?  This is merely the latest tempest in a teapot in my opinion and will do nothing to change the economy.  However, there is one interesting feature of the employment situation that can be directly attributed to the immigration situation.  As you can see in the FRED chart below, since March, the number of foreign-born workers has declined by 1.46 million while the number of US born workers has increased by more than 1.8 million.  I would say that as long as American citizens are finding jobs, President Trump is likely to remain quite popular across the nation despite all the negative press.

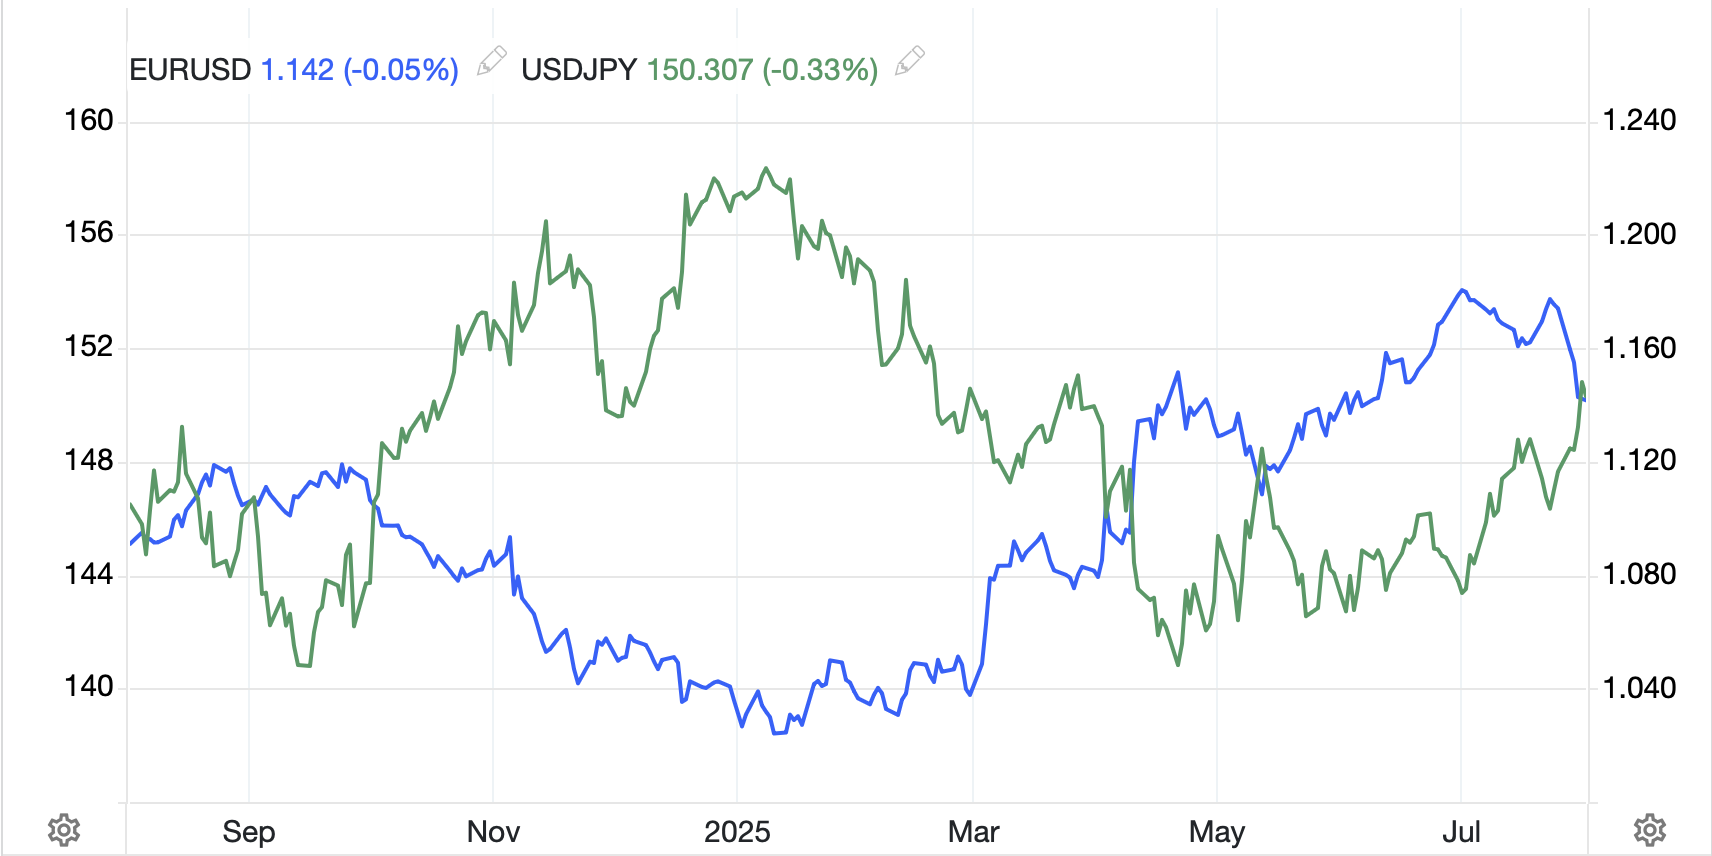
The weak NFP report altered the narrative on Friday, with bond yields, equity markets and the dollar all tumbling and the probability of a September rate cut jumping to 80%.  Perhaps President Trump is correct, and it is time to cut rates.

That’s all for this special Sunday night edition.

Good luck

Adf

Stroke of a Pen

While NFP’s top of the list
For traders this morning, the gist
Of recent releases
Show more price increases
A trend that cannot be dismissed
 
As well, Tariff Man, once again
Imposed more by stroke of a pen
While stocks are declining
The dollar’s inclining
To rise vs. the euro and yen


Let’s get the upcoming data out of the way first as the Employment report is due to be released at 8:30. Current median expectations are as follows:

Nonfarm Payrolls110K
Private Payrolls100K
Manufacturing Payrolls-3K
Unemployment Rate4.2%
Average Hourly Earnings0.3% (3.8% Y/Y)
Average Weekly Hours34.2
Participation Rate62.3%
ISM Manufacturing49.5
ISM Prices Paid70.0
Michigan Sentiment62.0

Source: tradingeconomics.com

This report is obviously of great importance as the Fed continues to rely on a solid labor market as its key justification for not cutting rates.  At least that’s its public stance.  Recall, too, that last month’s result of 147K was significantly higher than forecast and really backed them up.  In fact, I would contend that one of the reasons that Chairman Powell was willing to sound mildly hawkish on Wednesday is because of the labor market’s ongoing performance.  

It is interesting to juxtapose this strength with the increasing number of stories about how the increase in investment and usage of AI, especially at tech firms, is driving a significant amount of personnel reductions.  And yet, the broad data continue to point to a solid labor economy.

However, I think it is worth taking a closer look at recent inflation focused data as that, too, is going to be a key driving force in the central bank debate worldwide.  Yesterday’s PCE data was largely as expected but resulted in a faster pace of inflation on both the headline and core bases.  If we consider the trend over the past three years, as per the Core PCE chart below, it appears that the nadir was reached back in June of last year, and while not every print has been higher, I will contend the trend is starting to point upwards.

Source: tradingeconomics.com

Meanwhile, if we turn our attention to European inflation data, while this morning’s Eurozone flash print was unchanged from last month, it was higher than expected.  We saw the same trend in individual Eurozone nations yesterday with Germany, Italy and France all showing the recent disinflationary trend stopping, at least for the past month.  With these recent releases, the analyst community is of the mind that the ECB is likely to hold rates steady again in September, extending the pause on their previous rate cutting cycle.  The strong belief is that US tariffs are going to dampen economic activity and, with that, inflation pressures.

As to the US, with President Trump having announced another wave of tariffs yesterday, as the 90-day window closed, once again the analyst community is calling for inflation to rise here.  Ironically, these analysts may be correct that US inflation is going to be slowly heading higher, but whether that is due to tariffs, or perhaps the fact that more than ample liquidity remains in the economy and services prices continue to rise has yet to be determined.

At this point, I think it might be useful to break out an updated version of a chart that has made the rounds before showing price changes since 2000 broken down by categories.  Virtually every sector that has seen significant price rises is on the service side of the ledger while most goods saw either deflation or very modest (~1% per annum) inflation.

Housing, which is both a good and a service, and textbooks, which are directly linked to tuition, are the two outliers.  Now, many will complain that something like New Cars having risen only 24.7% since 2000 is crazy given their much higher sticker prices, and that is clearly hedonic adjustments doing its job.  But if you consider the key expenses in your life, housing, food and health care are generally top of the requirements.  It is abundantly clear from this chart that the American angst on prices is well founded.  With that in mind, tariffs are exclusively imposed on goods, not services, so given services represent 77.6% of the US economy as of 2022 (as per Grok), the inflationary impact of tariffs seems like it might not be quite as high as the hysteria indicates.

(This is a perfect time to remind you of a great way to manage your inflation risk if you participate in the cryptocurrency markets by buying USDi, the only fully backed inflation tracking coin available.  Learn more at www.usdi.com.  It is essentially inflation-linked cash.)

Coming back around to the market, I think it is a good time to review one of the other major narrative themes, that the dollar is collapsing as foreigners flee because of the massive debt load, and that the dollar will soon lose its reserve status.  You know I have dismissed this idea from the beginning as nothing more than doom porn and an effort by some analysts to get clicks.  

There is no doubt that there had been a downtrend in the dollar for the first six months of 2025, and as has been written repeatedly, the decline was the largest during the first half of the year since the 1980’s.  As well, my concern over the dollar has been based on the idea that the Fed would indeed be cutting rates despite no need to do so, and that would undermine its yield advantage.  But a funny thing happened on the way to the death of the dollar, it stopped falling.  While I have been using the DXY chart as my proxy, pretty much every chart looks the same as per the below of both the euro and yen, where the nadir was at the beginning of July and the dollar has risen vs. both somewhere between 3% and 5%.

Source: tradingeconomics.com

In fact, as I look down my board, the dollar has risen against every major currency over the past month, with even tightly controlled CNY declining -0.8%, and the yen falling furthest, down nearly -5.0%.  Combine this with the news that Treasury auctions have been well attended with significant foreign interest, and it is hard to conclude the end is nigh for the US economy.

Ok, a really quick turn to markets here as this has gone on longer than I expected.  Equities are red everywhere this morning after yesterday’s US declines.  Japan (-0.7%), China (-0.5%) after weak PMI data, Hong Kong (-1.1%) and Australia (-0.9%) set the tone for Asia.  In Europe, it is even worse with the CAC (-2.2%) and DAX (-1.9%) both under more pressure as a combination of increased worries over trade (although given they ostensibly have a deal, I’m not sure what the issue is) and companies there reporting weaker than forecast results have been the problem.  US futures at this hour (7:30) are all pointing lower by about -0.85%.

Despite the fear in stocks, bonds are not seen as the answer this morning with Treasury yields edging higher by 1bp and European sovereign yields all higher by between 3bps and 5bps.  I guess the inflation reading has a few traders nervous.  Interestingly, if you look at the ECB’s own website showing rate change probabilities, there is a 14% probability of a rate HIKE priced in for the September meeting!  JGB yields have also edged higher by 1bp as the BOJ, in their policy briefing yesterday, raised their inflation forecasts for 2026, ostensibly as a precursor to the next rate hike there.  I’ll believe it when I see it!

As to commodities, oil (-1.1%) after touching $70/bbl yesterday has rejected the level.  While secondary sanctions on Russian oil exports continue to be discussed, they have not yet been implemented.  I continue to believe the price ought to be lower, but clearly there is a risk premium for now.  In the metals markets, gold (+0.4%) continues to find support despite weakness in other markets (Ag -0.6%, Cu -0.9%) as its millennia-long status as the only true safe haven is reasserting itself.  After all, Bitcoin (-0.6%) has not been able to match the relic’s performance of late despite its modern twist.

And that’s really all there is (I guess that’s enough) as we head into the weekend.  The market tone will be set by the NFP data, where my take is a strong report will see the dollar rally, bonds suffer, and stocks suffer as well as hopes for a rate cut fade further.  Conversely, a weak report should see the opposite impacts.

Good luck and good weekend

adf