
Though Friday things looked pretty dicey
With tech stocks then seen as quite pricey
New word that the bombing
Has ended was calming
And stock markets opened quite spicey

Of course, it can be no surprise
That oil’s now well off its highs
The dollar is slipping
Though yields are just dripping
As bond traders still agonize
President Trump changed his mind about continuing the recent bombing campaign against Iran over the weekend amid questions about alleged US munitions supplies. But whatever the reason, this was music to the risk markets with oil (opening -6.4%) falling sharply while equity futures (NASDAQ opening +1.25%) rebound from last week’s declines. Once again, headline risk remains the biggest risk there is in markets. Note the huge gap lower in the oil market early Sunday evening in the chart below from tradingeconomics.com
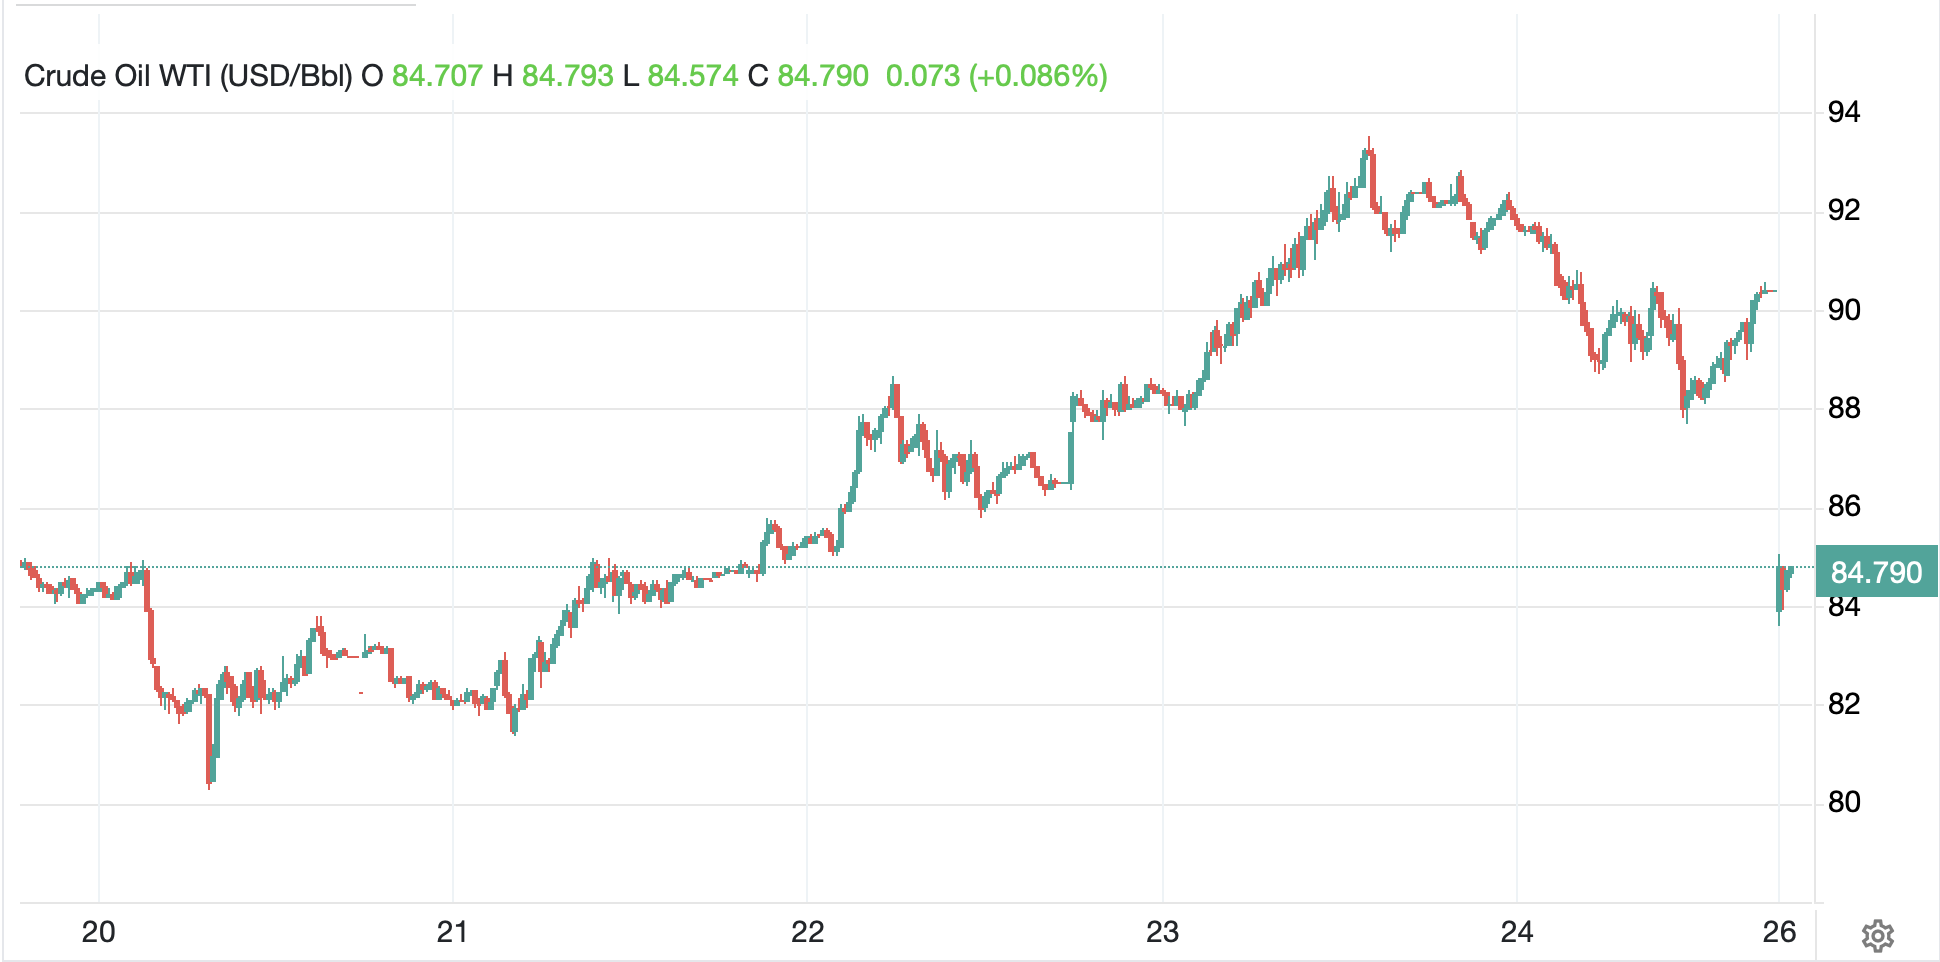
At this point, it is a fool’s errand to try to estimate where oil prices are heading going forward as the next headline is likely to be the key driver, and that is a complete unknown.
So, let’s turn our attention to some more fundamental questions that have been brewing in the background and are pretty complex. I want to start with a remarkable Substack piece I read this weekend which had a completely different perspective on the AI investment thesis than anything that I have seen anywhere else. And it is quite a persuasive piece. While I have linked it above, it is quite a long read, so the highlights are as follows:
- The AI boom is not a tech boom; it is a credit driven real estate cycle
- This is virtually identical to the run-up to the subprime housing crisis and GFC
- The key to understand is the second derivative of growth, acceleration.
- GroundBreaker’s (the author) thesis is that the second derivative on AI valuation has already rolled over and the future for AI stocks is pretty bleak, at least in the medium term.
Below are two charts from his Substack to help describe the issue:
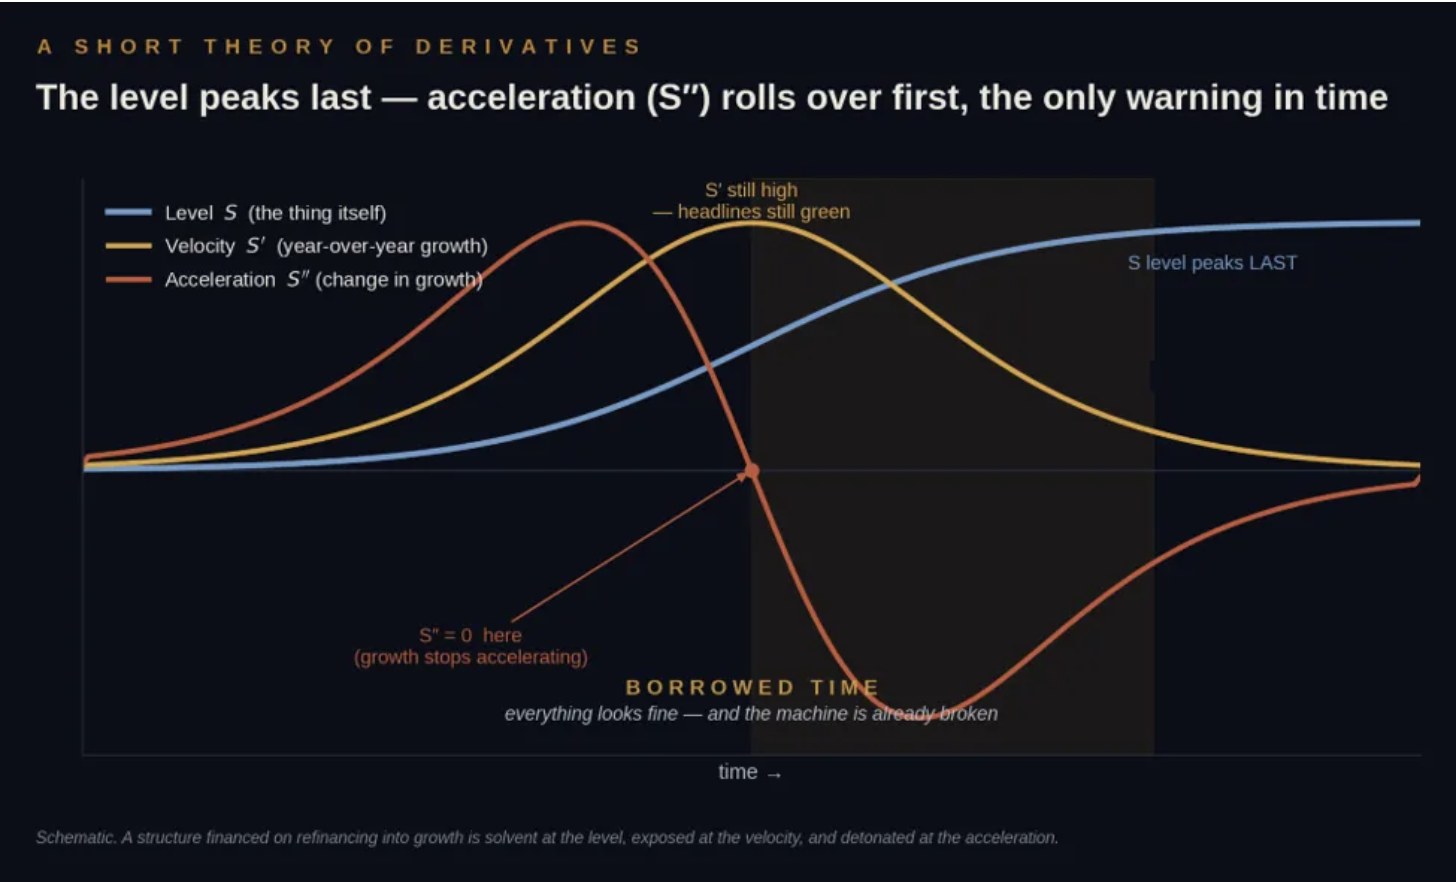
This is a basic description of the movements of the underlying (blue line), its velocity (growth rate, yellow line) and its acceleration (the change in its growth rate, red line). As you can seem growth can still be increasing, but at a slower rate, and that’s the problem he highlights.
Below is a chart of OpenAI’s valuation metrics (remember it’s private so the values are episodic, not continuous, but the point is if the change in the rate of growth of the valuation metric starts declining, that is the break where things become a problem, i.e. they may not be able to finance their projected growth going forward.
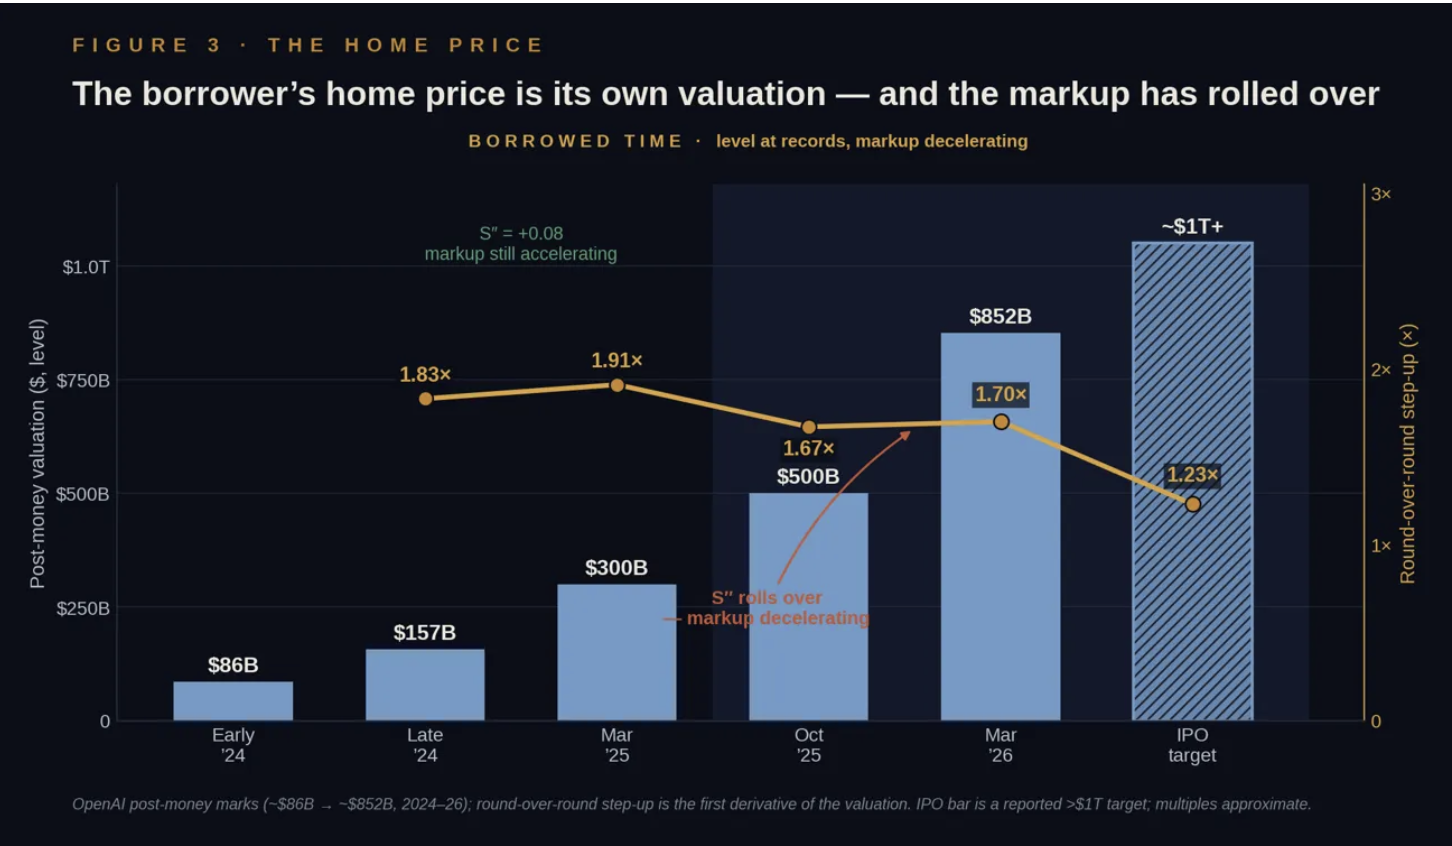
And as you can see, it is already heading lower. This does not speak well to the future for OpenAI, and I would argue, the entire space, as many have made the case this is all Ponzi finance, meaning the funding cannot be repaid on cashflows, only on increasing valuations.
Now consider the subprime crisis where the problems started when the rate of housing price increases rolled over and all those 2-year teaser rates could no longer be financed at higher valuations. That’s when they all went bust! Here’s the thing; the 2nd derivative rolled over in late 2006, the first hiccups didn’t happen until mid-2007 with SocGen closing some funds, Lehman didn’t go bust until September 2008 and the equity market didn’t bottom until March 2009. It can take a long time for this to play out, but beware the cycle, it could well repeat in AI linked investments.
So, there’s that to consider.
The other thing that I’ve been pondering is gold and its meaning within the financial markets. Unlike the AI discussion above, I want to discuss two very real sides to this story. On the one hand, the ongoing destruction of the value of fiat currencies by all major central banks’ policies is real. Money continues to get printed and inflation continues to rise debasing those fiat currencies. Adding to the problem is the massive government debt issuance which, if history holds, will be sopped up by those very same central banks, adding to the debasement. The search for a neutral reserve asset to replace US treasuries is real, but the transition will take a very long time, in my view. However, all this speaks to increased demand for the barbarous relic, and when that is priced in declining fiat currencies, a higher price. I think it’s a very strong argument and has been made by many, including this poet. After all, gold is often thought of as the ultimate inflation hedge.
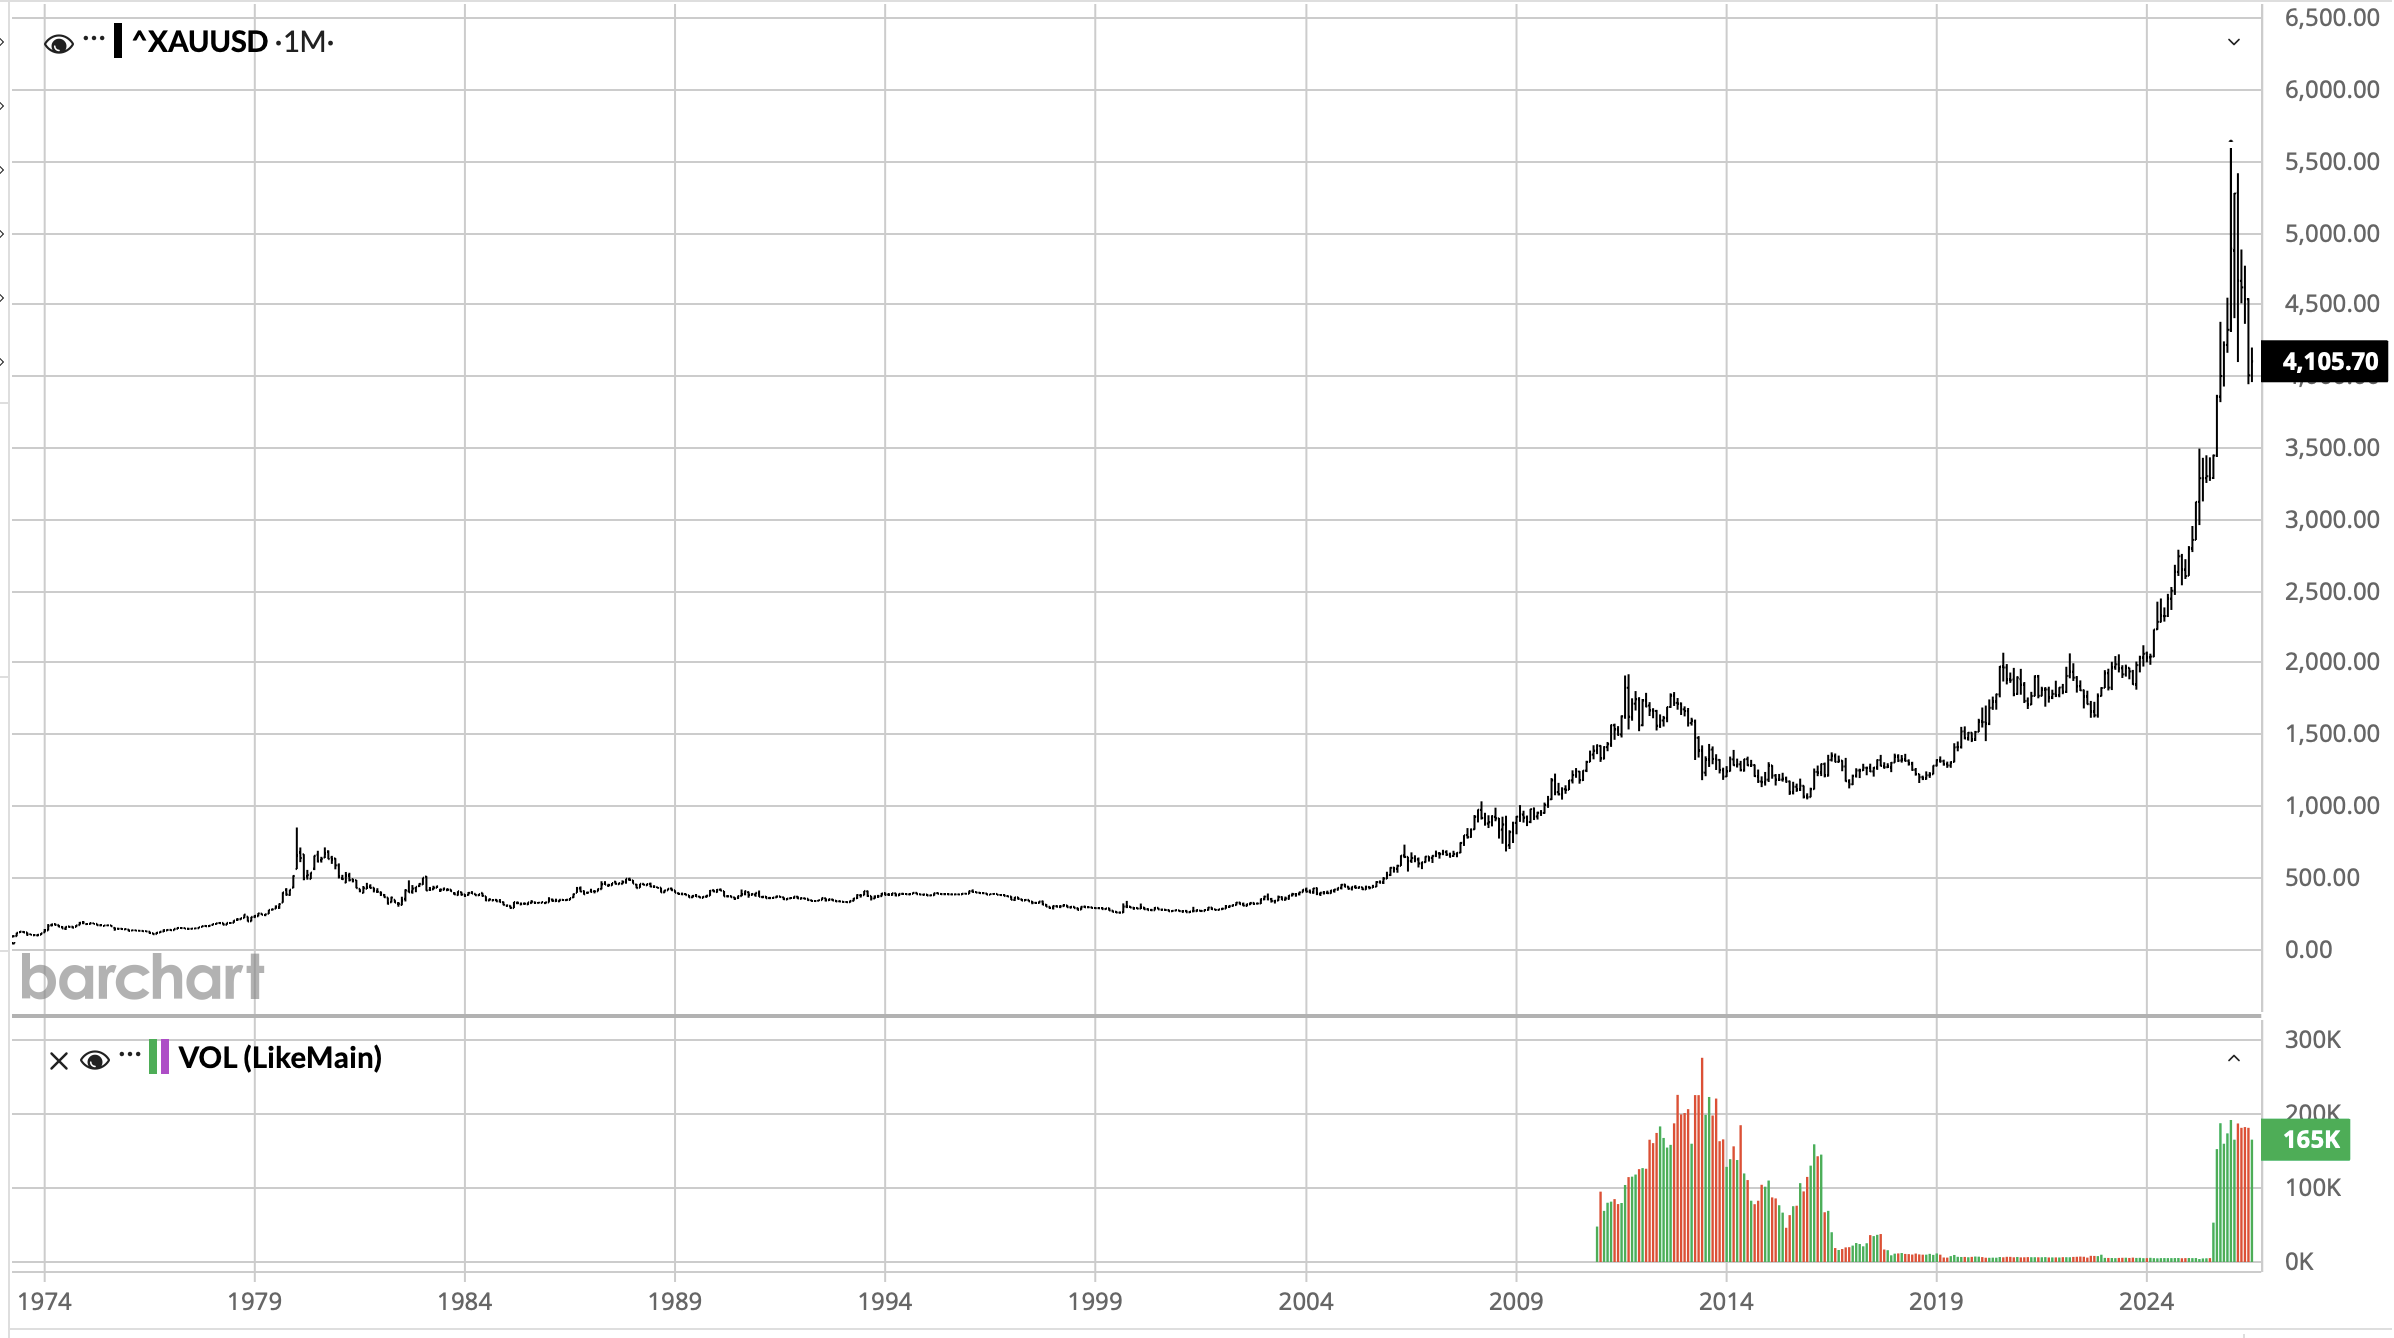
So, what is the flipside? As I have written frequently regarding oil prices, we cannot ignore the market pricing and what it is telling us. Understand that I have been a gold bull for a long time and strongly believe in the long-term debasement concern. But as a long-time trader and market participant, it is very difficult for me to look at the below, long-term chart of gold and not think that there is a much further decline on the cards. Parabolic moves, historically, do not resolve by trading sideways for extended periods of time, they fall back… a lot!
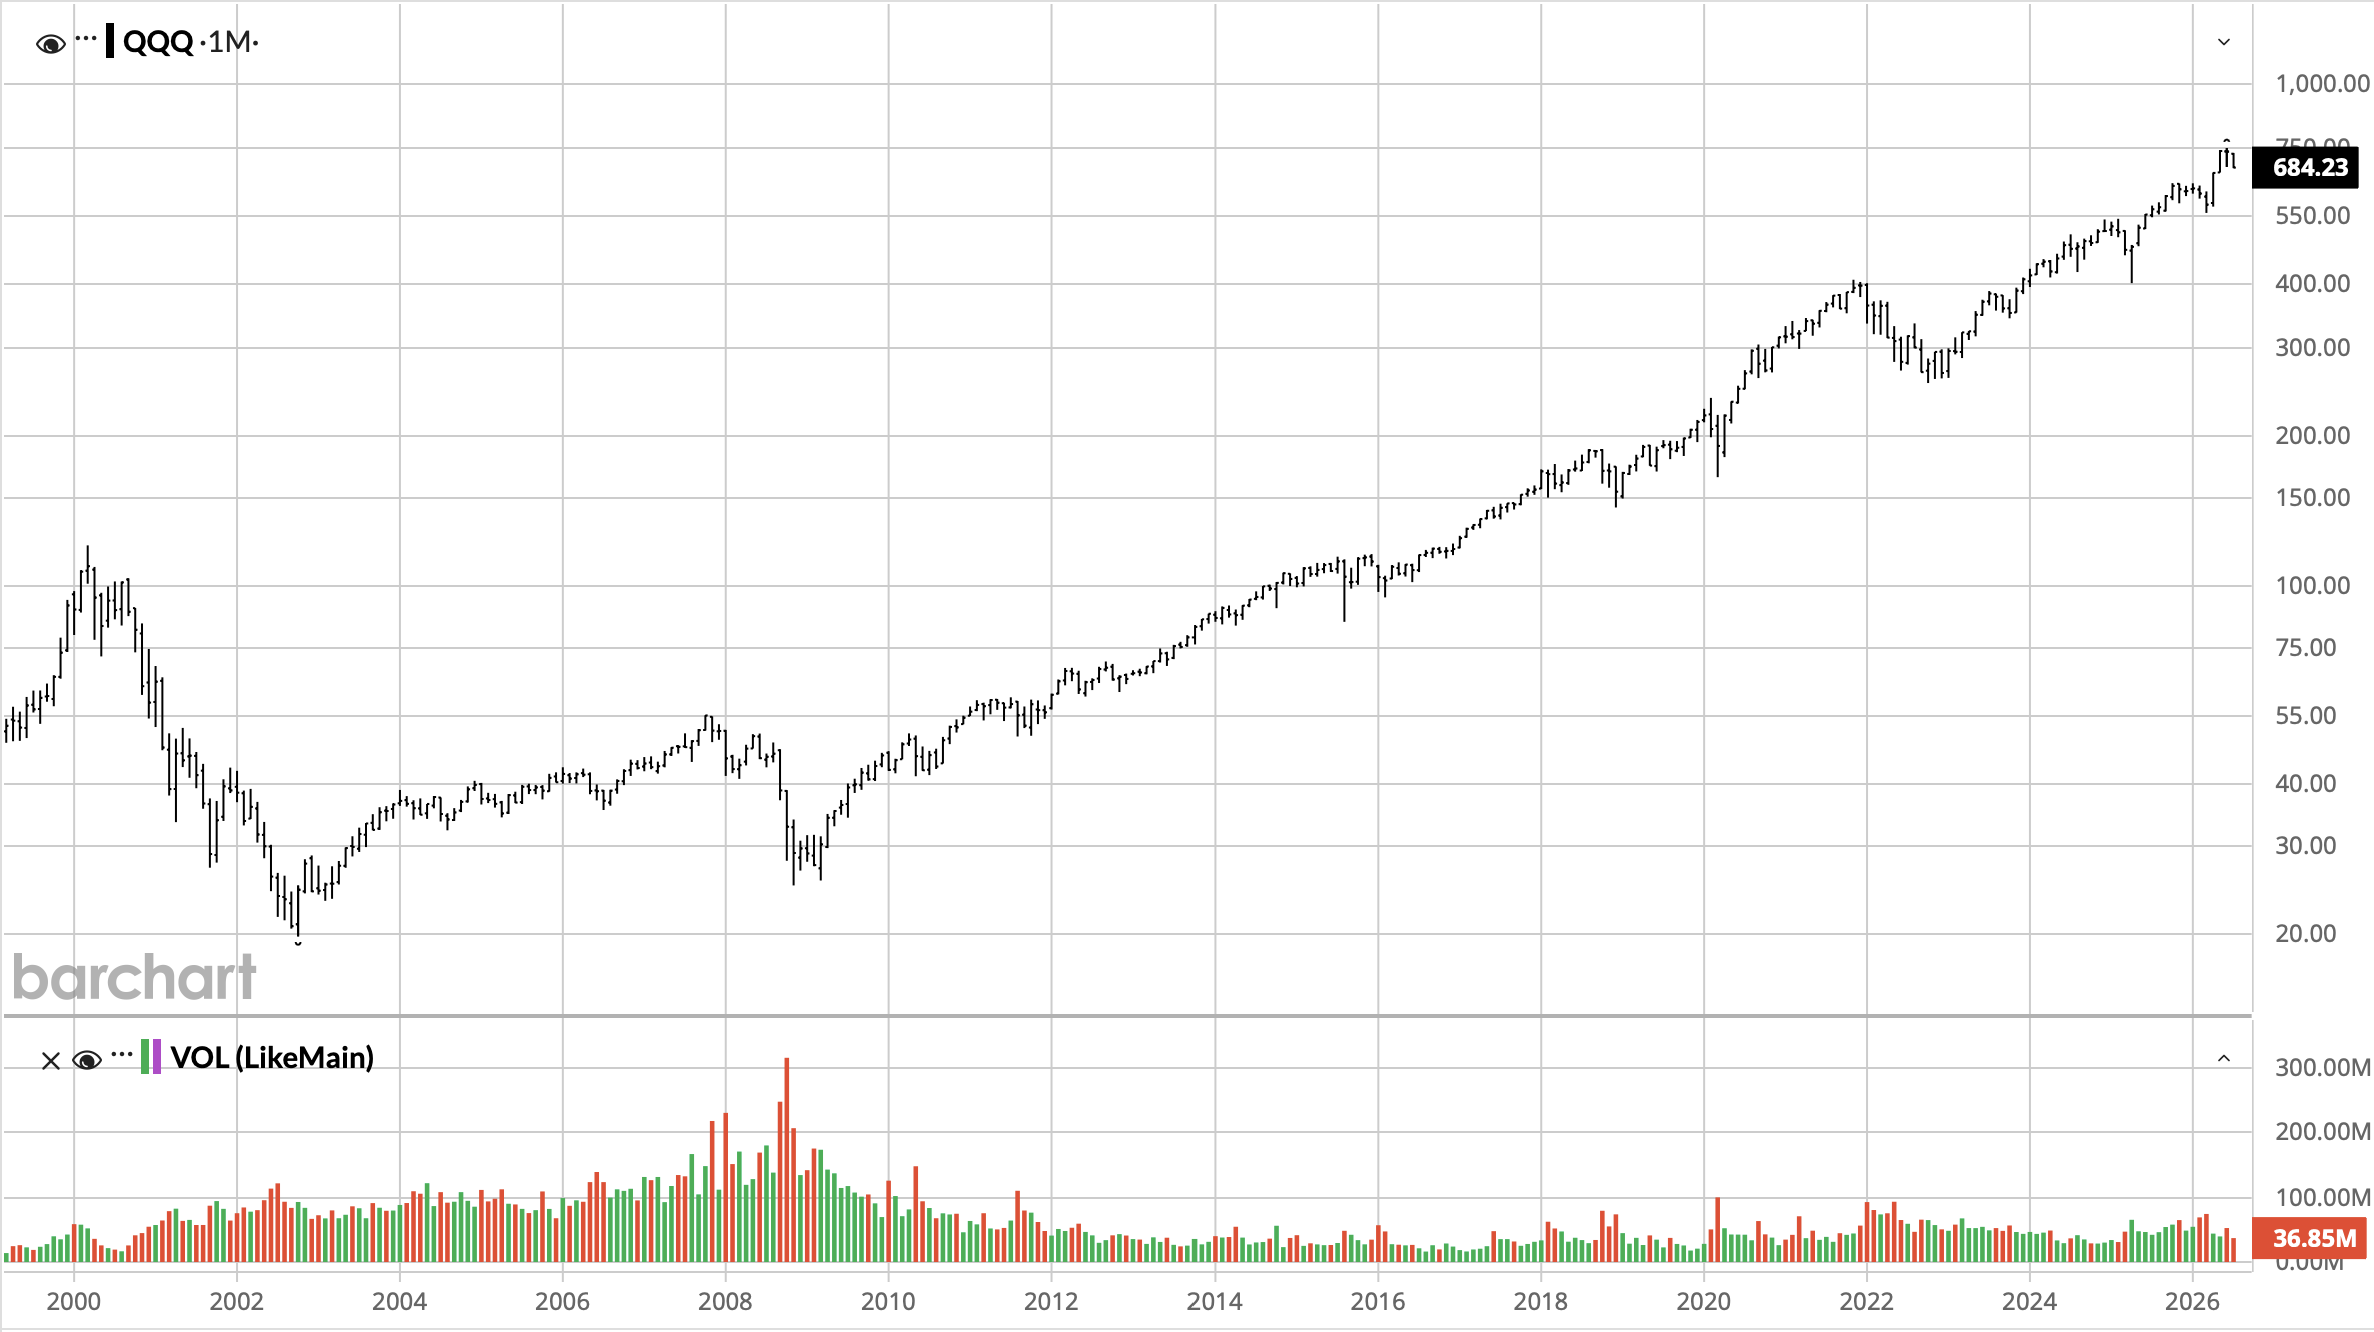
While we have recently seen several parabolic moves in market prices, notably the NASDAQ and KOSPI, I want to highlight the last time the NASDAQ had a parabolic move, during the tech bubble in 1999-2000. The chart below is a logarithmic chart of the QQQ ETF. As you can see back in 2000 – 2002, it fell a very long way after the bubble burst, some 88%, a much larger move than during the GFC!
There is one other trading market, that while many may dismiss its meaning, I would contend is very representative of the way markets behave across all asset classes, Bitcoin. The below chart shows it from its beginning, and you can see a number of essentially parabolic moves higher, each resolving with a decline of at least 50% and at times more than 70%.
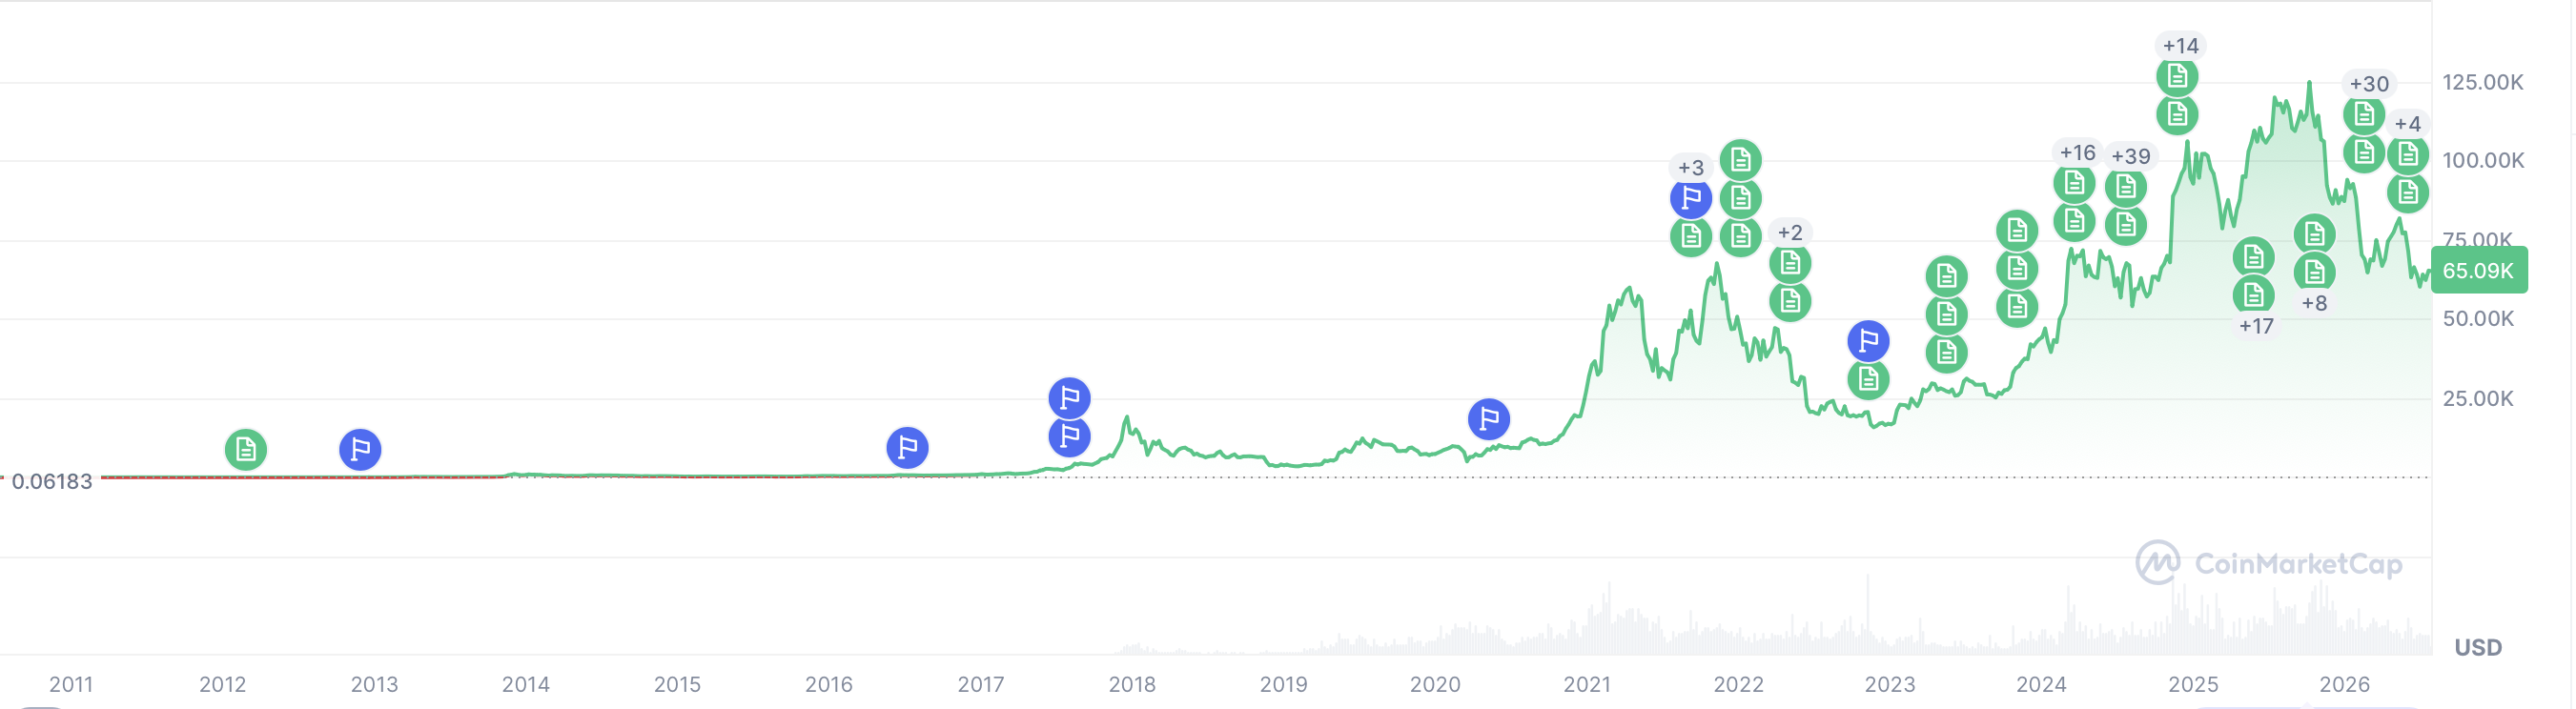
Source: coinmarketcap.com
My point is that gold shows all the signs of having peaked for a while, and it has ‘only’ fallen some 25% from its highs. From a trading history perspective, there is nothing that would seem to prevent a move down to $2800/oz or so, a 50% retracement from the high.
So, which is it? As I remain long gold in the personal portfolio, I have been a beneficiary of the long climb higher and would love to see it continue. And there is much to be said for the debasement theory. But both sides of this argument can be correct with the time frame the key differentiator. We could see a further short-term decline before a renewed upward move of significant magnitude. Much will depend on how global macroeconomics and economic statecraft plays out over the coming months/years. And this is why trading is hard! One last thing describing just how much things have changed regarding gold and sentiment around it, this headline in Bloomberg this morning is remarkable, Gold Climbs as Pause in Mideast Fighting Curbs Inflation Risk.
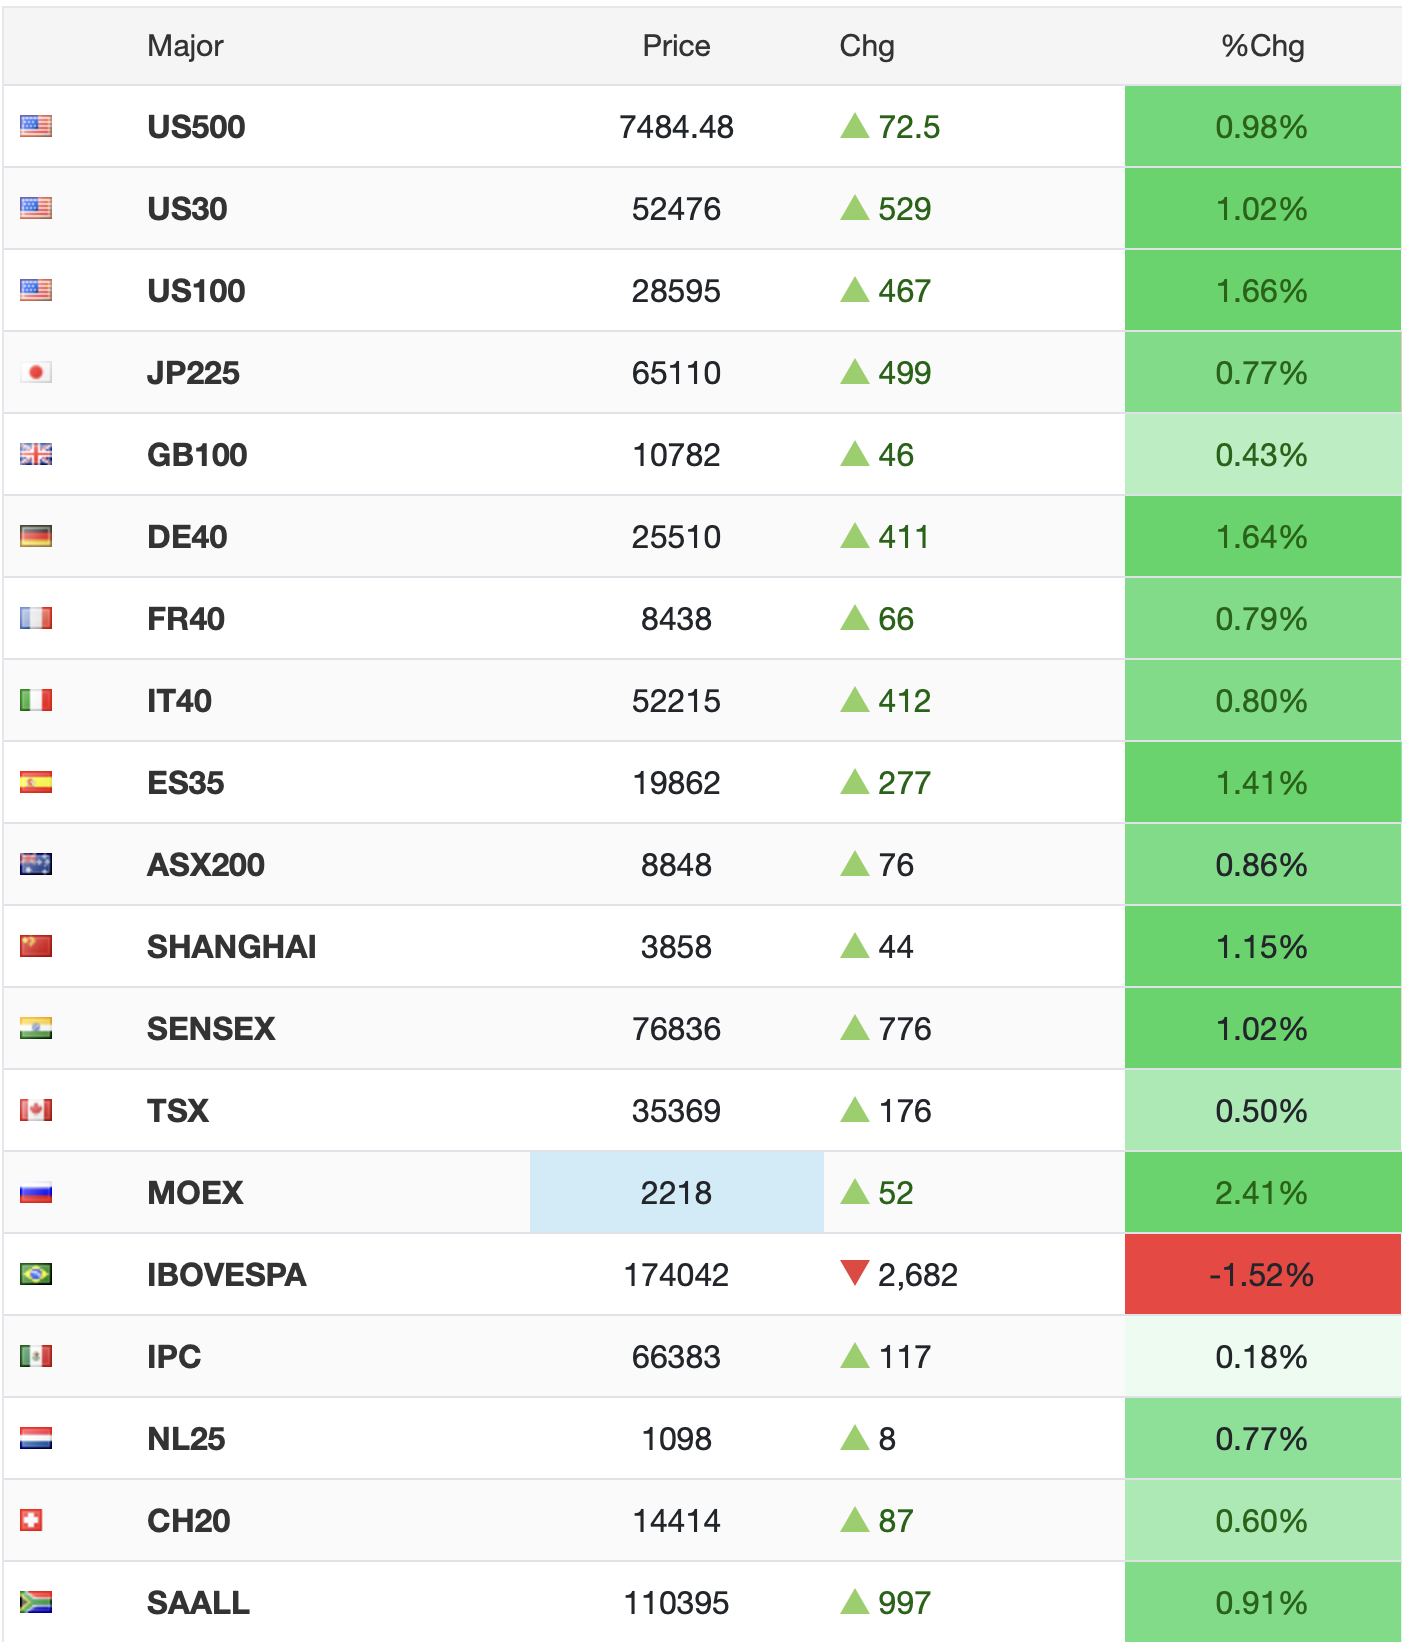
Ok, sorry for my rants, but a brief tour of markets show things are exactly as you would expect based on the reduction of tensions in Iran. Equity markets are higher around the world as per the below tradingeconomics.com screen shot, and don’t be fooled by Brazil, it hasn’t opened yet and there are no futures, so that was Friday’s performance.
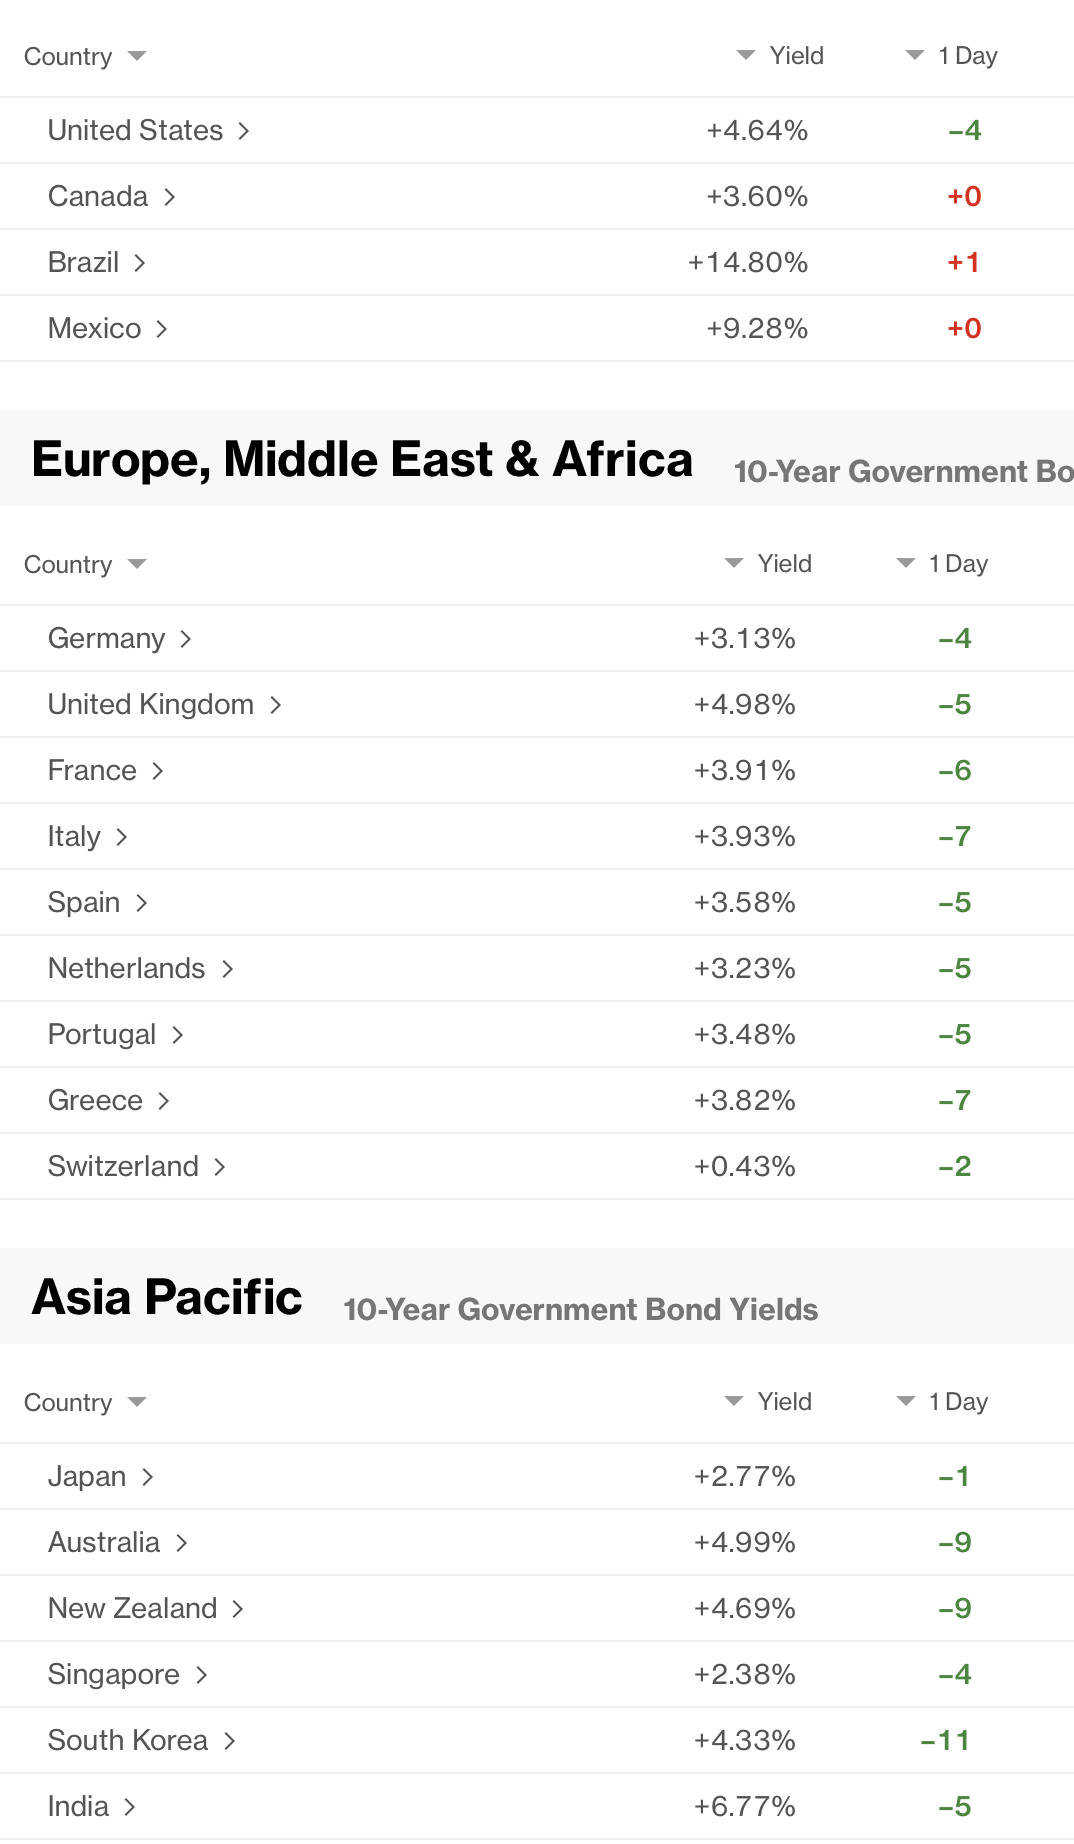
As to bond yields, they too, are lower across the board as per the below Bloomberg.com screenshot. Canada, Mexico and Brazil markets are not yet opened, hence the lack of movement.
Oil has fallen further than when I started writing last evening with WTI (-8.2%) and Brent (-9.7%) both sharply lower. Regarding Brent, apparently there has been a resumption of flows through Kazakhstan which is helping even more there. Metals are higher (Au +1.1%, Ag +2.2%, Cu +0.9%), which is keeping with the latest theme. And finally, the dollar is broadly softer, as also would be expected given the movement in other markets. The two key exceptions here are NOK (-0.7%) which is clearly a reaction to the movement in oil prices and KRW (-0.8%) which actually started the session much stronger but has reversed. While I read a rationale about concerns over a Fed rate hike, given the movement in oil and yields, that doesn’t seem right. Rather, after a more than 6% appreciation over the course of the past 3 weeks, it seems more like a reflexive bounce in the dollar.
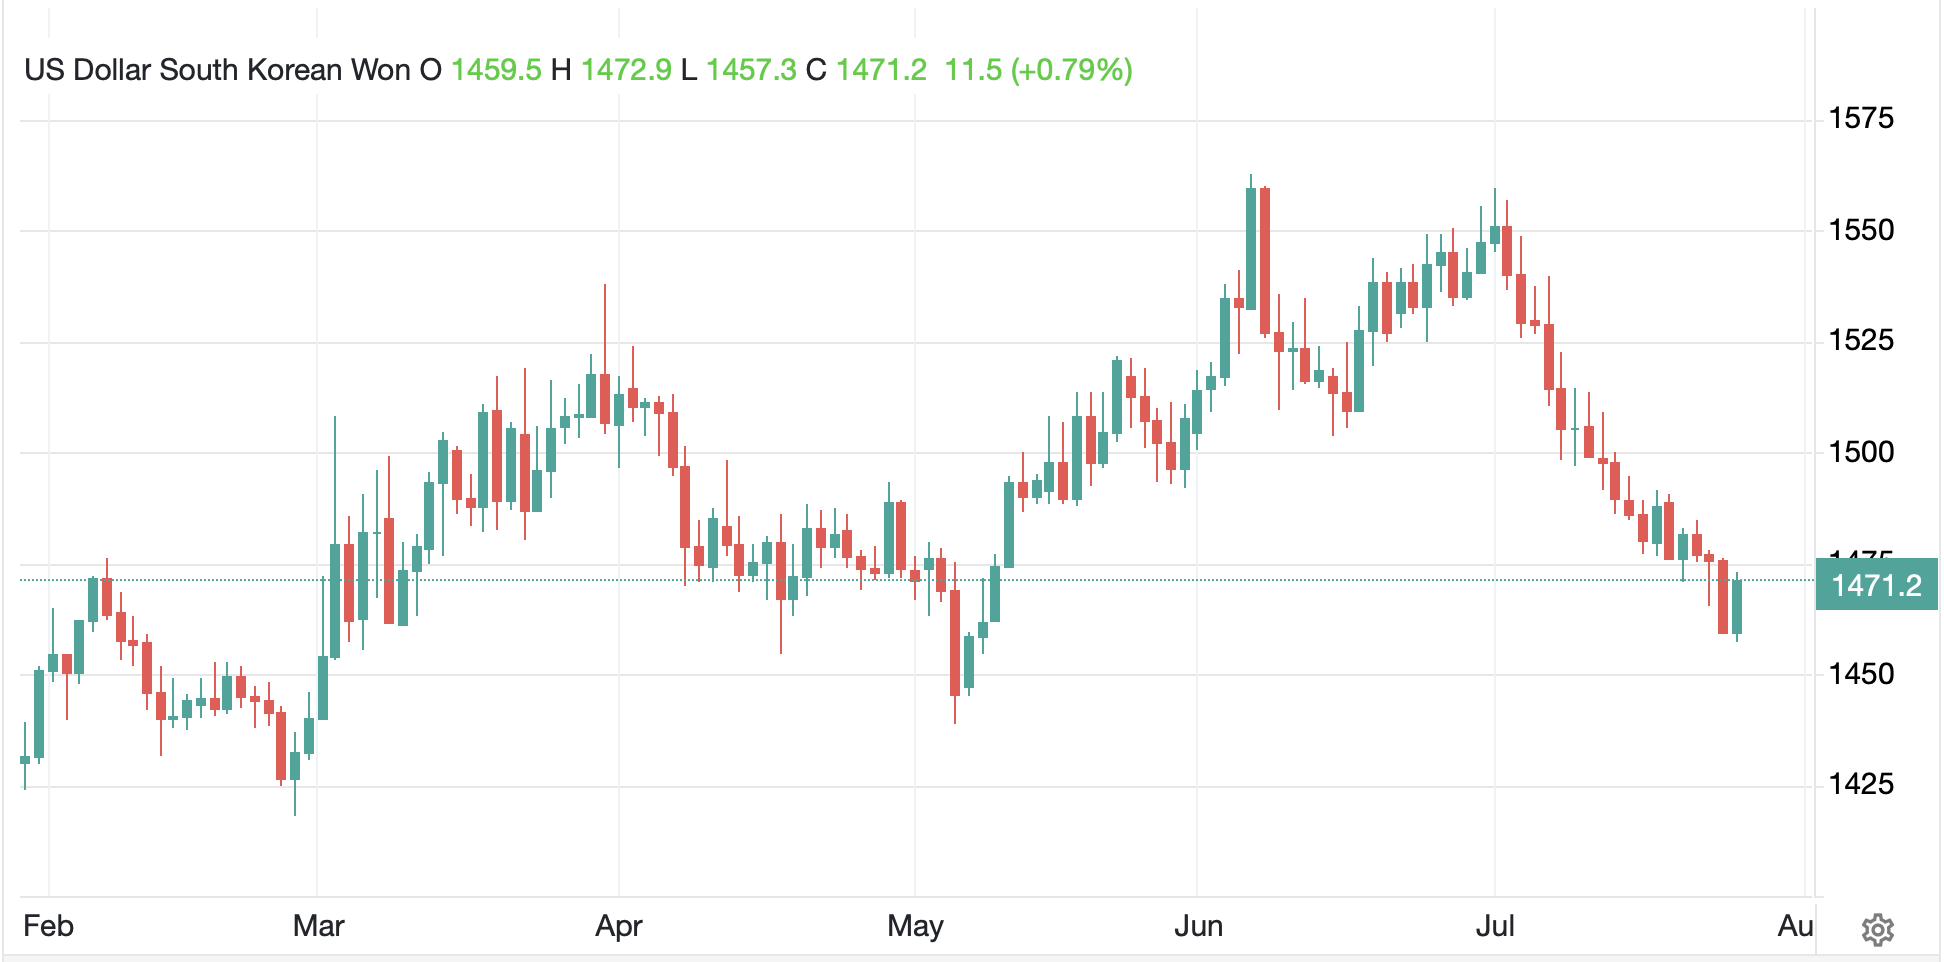
Source: tradingeconmomics.com
On the data front today, this morning brings Durable Goods (exp 2.5%, 0.8% ex-Transport) but that is all. I will go deeper tomorrow, and remember, the FOMC meets this week with the current pricing 33% for a hike, even after the decline in oil prices today. I remain in the no move camp but will discuss tomorrow.
And that’s more than enough.
Good luck
Adf

