Last night we saw two things of note
The first was exciting, not rote
The Artemis II
Launched higher and flew
Just like Jackie Gleason would quote

The other was Trump’s broad address
Regarding the Middle East mess
He said that the war
Was closing the door
So, Mullahs have no nuke access

For markets, though, this latter news
Was clearly at odds with their views
So, rallies we’ve seen
Have all been wiped clean
And bulls are now feeling the blues
I will start with the highlight of the evening, the successful Artemis II space launch, where NASA’s latest mission to send four astronauts to orbit the moon and come home began. As a child of the Sixties, I well remember being at Camp Mah-Kee-Nac, in Lenox Mass, with the entire camp gathered around a small black and white TV to watch Neil Armstrong step on the moon. A remarkable time and achievement that portends a great future.
The other story, though, was less optimistic, at least for markets in the short term. The President’s address did not signal an end was near, at least not to the market’s collective ear. Instead, Mr Trump made a series of statements and claims, many of which we have heard before, but here they were all gathered in one place.
- *TRUMP: IRAN’S NAVY IS GONE, AIR FORCE IN RUINS
- *TRUMP: MOST OF IRAN’S LEADERS ARE DEAD
- *TRUMP: IRAN’S ABILITY TO LAUNCH MISSILES AND DRONES CURTAILED
- *TRUMP: DON’T NEED OIL FROM MIDDLE EAST
- *TRUMP: WILL NEVER LET IRAN HAVE NUCLEAR WEAPON
- *TRUMP: CORE STRATEGIC OBJECTIVES IN IRAN NEARING COMPLETION
- *TRUMP: THESE STRATEGIC OBJECTIVES NEARING COMPLETION
- *TRUMP: MUST COMPLETE MISSION IN IRAN
- *TRUMP: WE WILL FINISH THE JOB VERY FAST
- *TRUMP: GETTING VERY CLOSE TO FINISHING JOB IN IRAN
- *TRUMP: WE ARE ON TRACK TO COMPLETE ALL MILITARY OBJECTIVES
- *TRUMP: WE WILL NOT LET MID EAST ALLIES GET HURT OR FAIL
- *TRUMP: WILL HIT IRAN EXTREMELY HARD OVER NEXT 2-3 WEEKS
- *TRUMP: WILL BRING IRAN BACK TO STONE AGE WHERE THEY BELONG
- *TRUMP: NEW LEADERS IN IRAN LESS RADICAL, MORE REASONABLE
- *TRUMP: IF THERE IS NO DEAL, WILL HIT IRAN’S ELECTRIC PLANTS
- *TRUMP: WE HAVE NOT HIT THEIR OIL EVEN THOUGH EASIEST TARGET
- *TRUMP: WILL HIT IRAN WITH MISSILES IF WE SEE THEM MAKE A MOVE
- *TRUMP: WE HAVE ALL THE CARDS THEY HAVE NONE
- *TRUMP: ON THE CUSP OF ENDING IRAN’S THREAT TO AMERICA
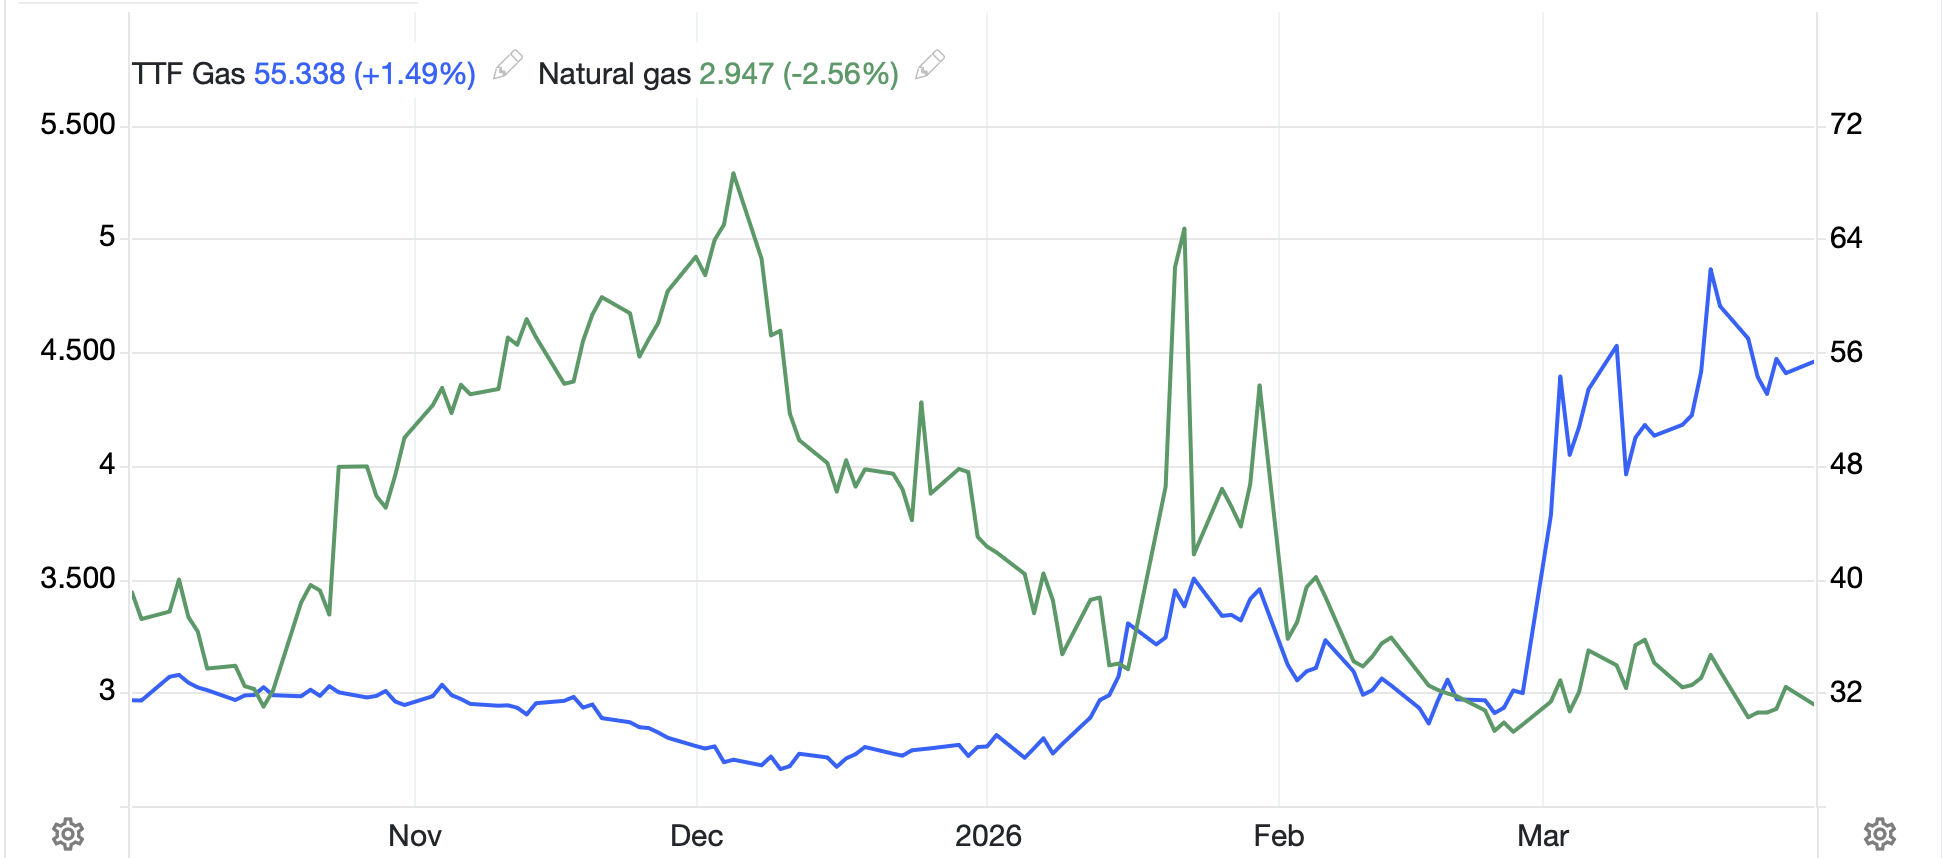
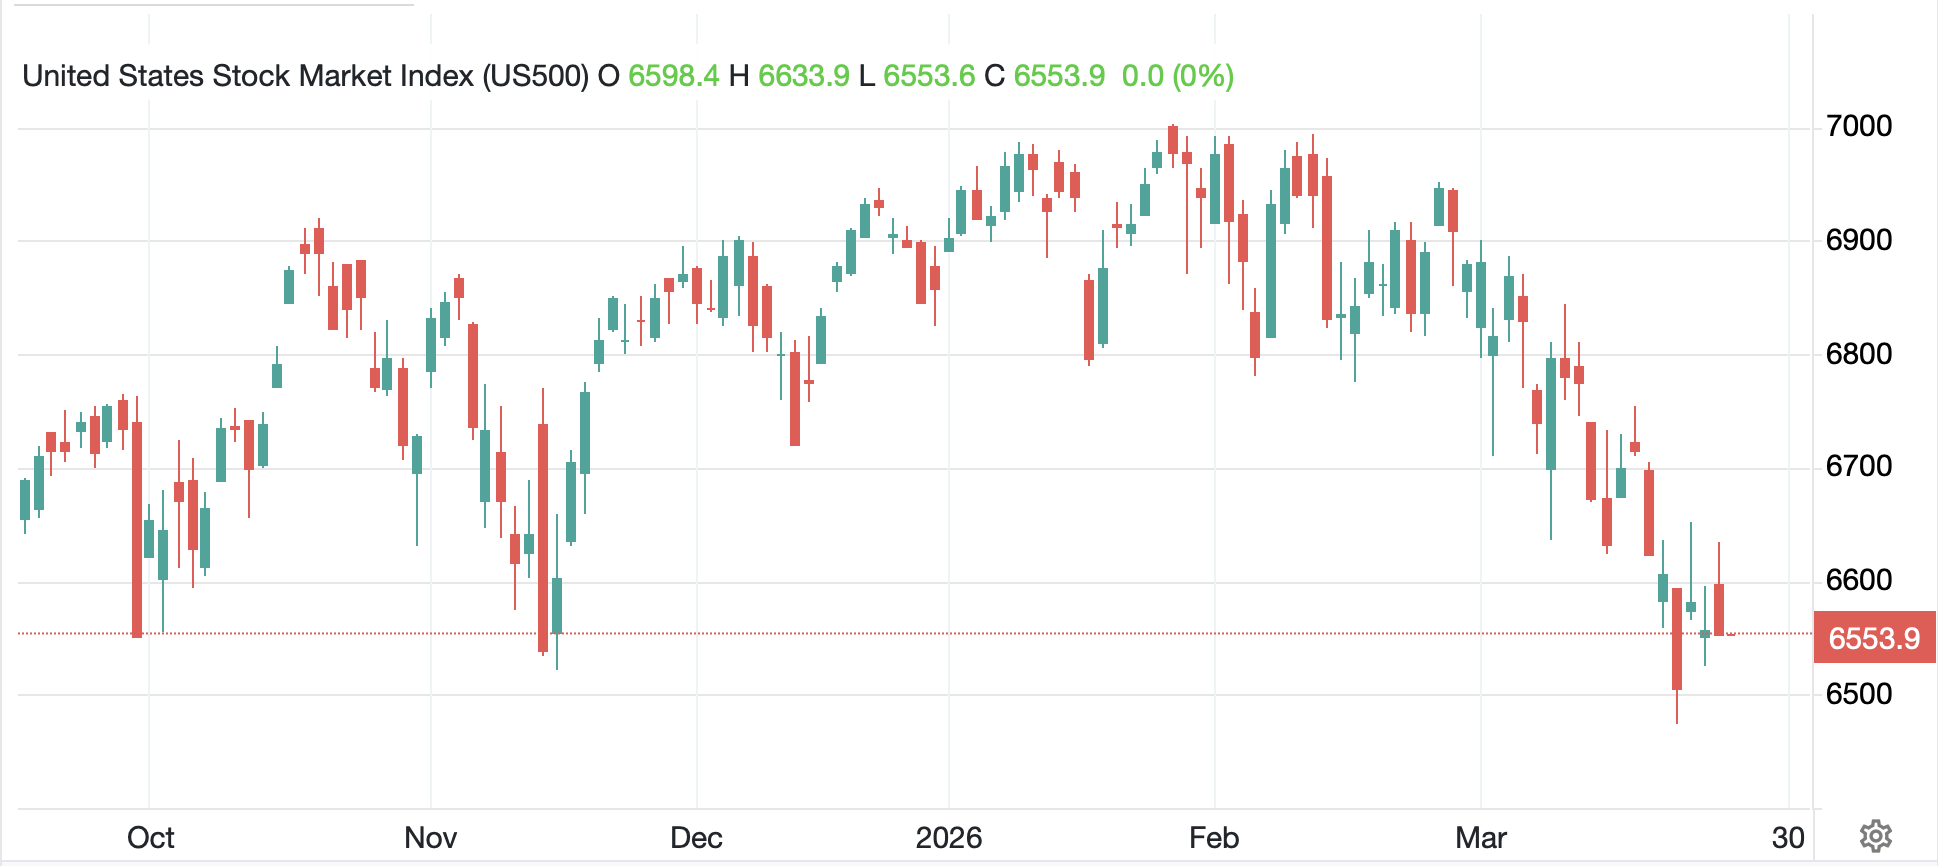
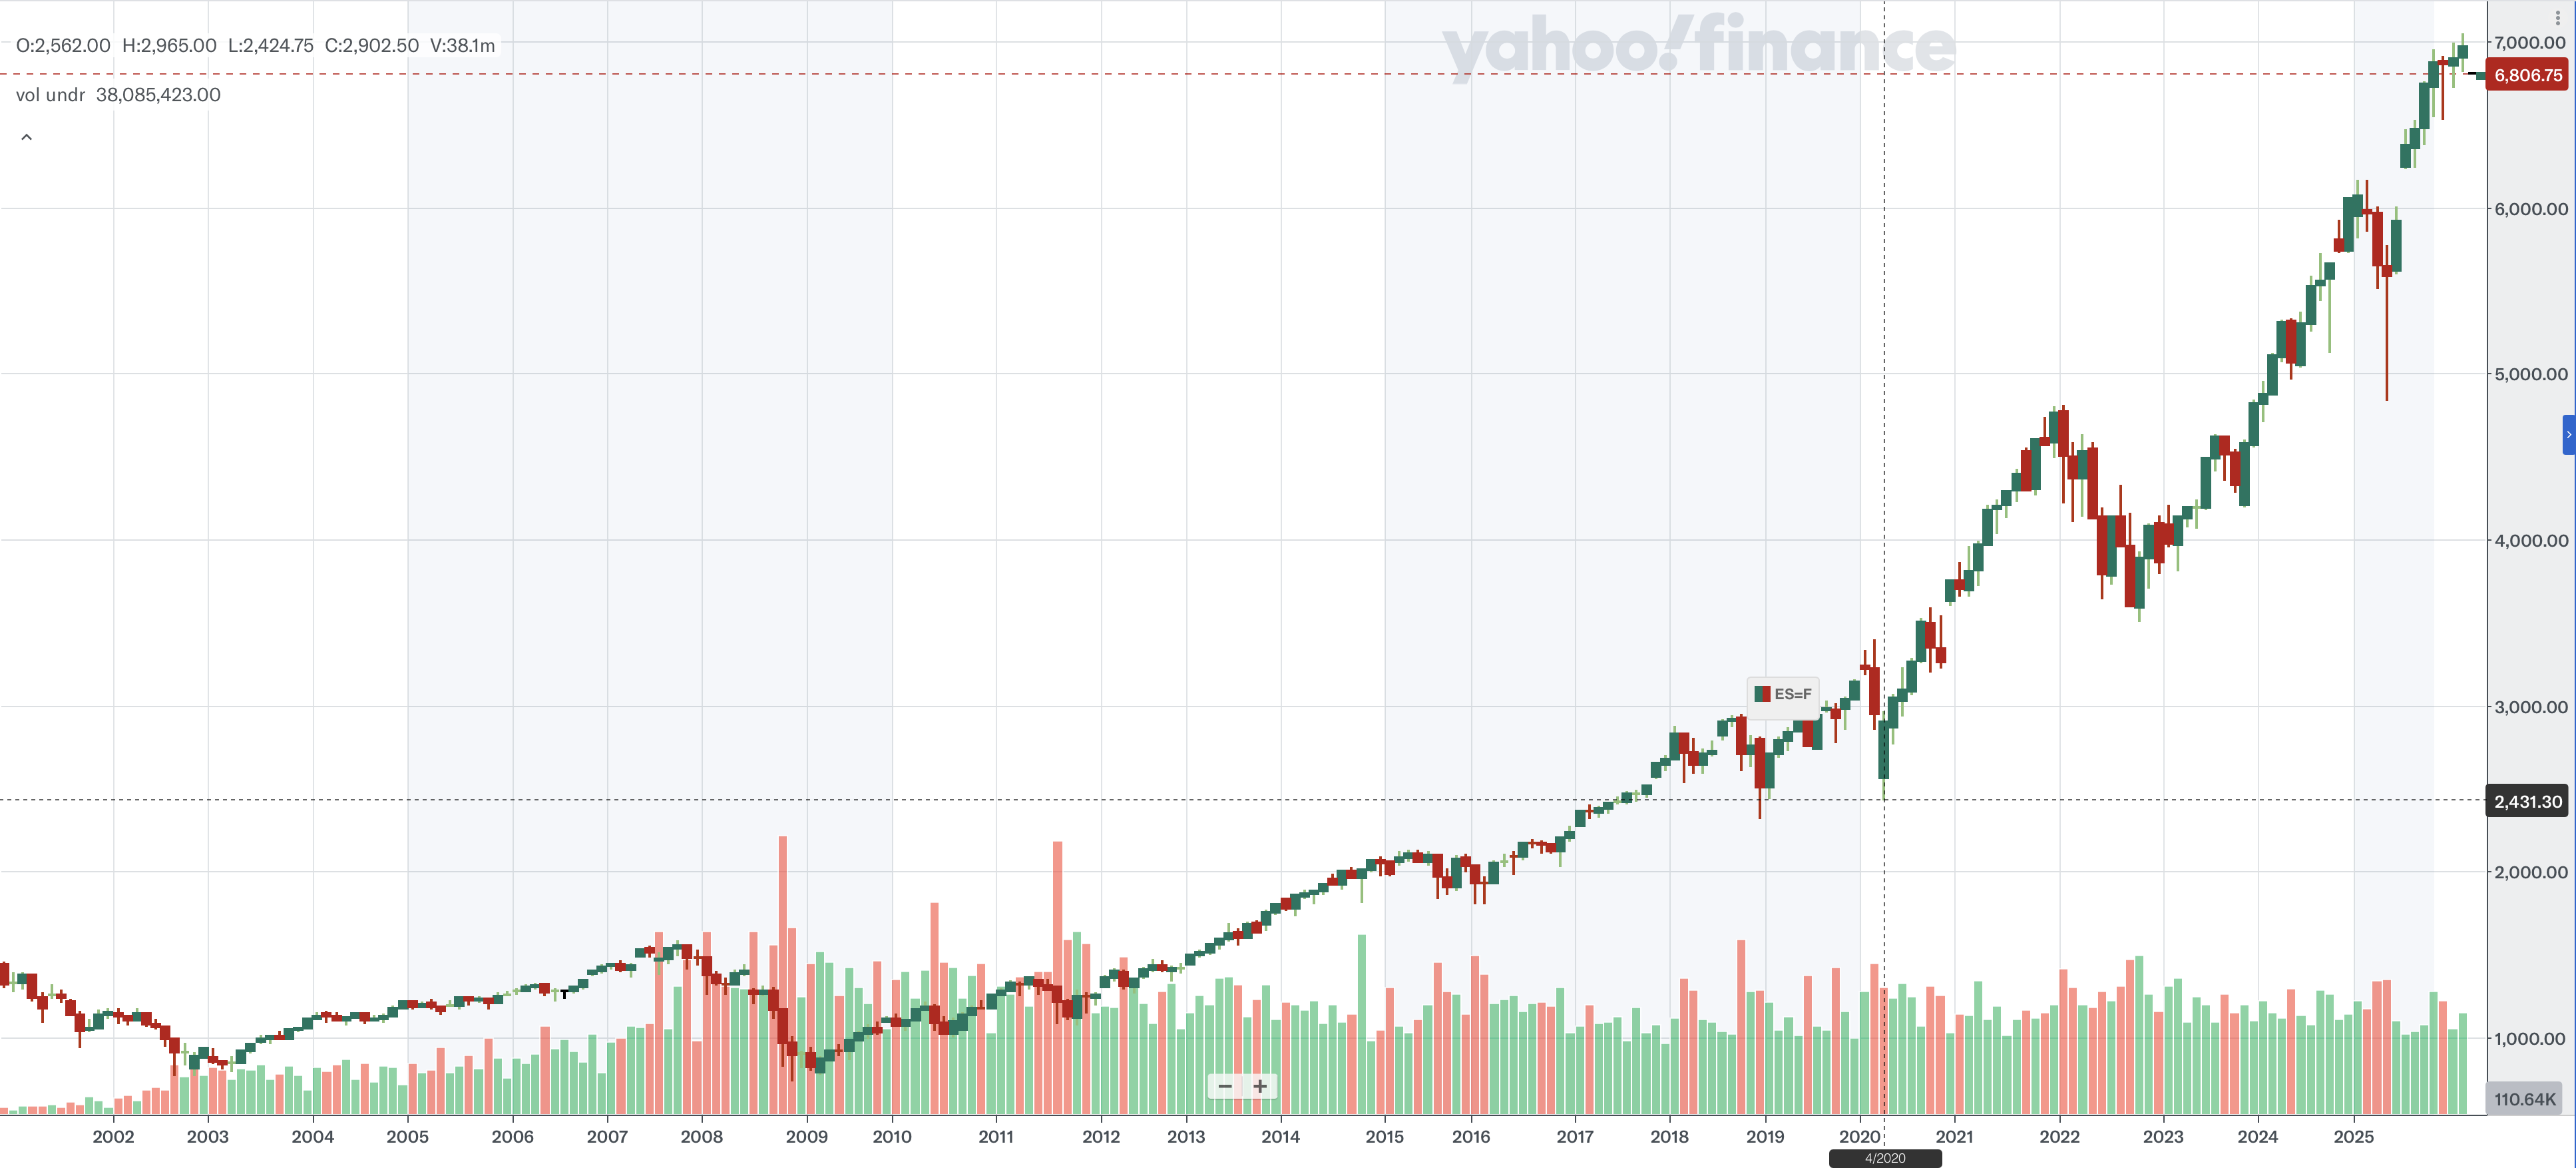
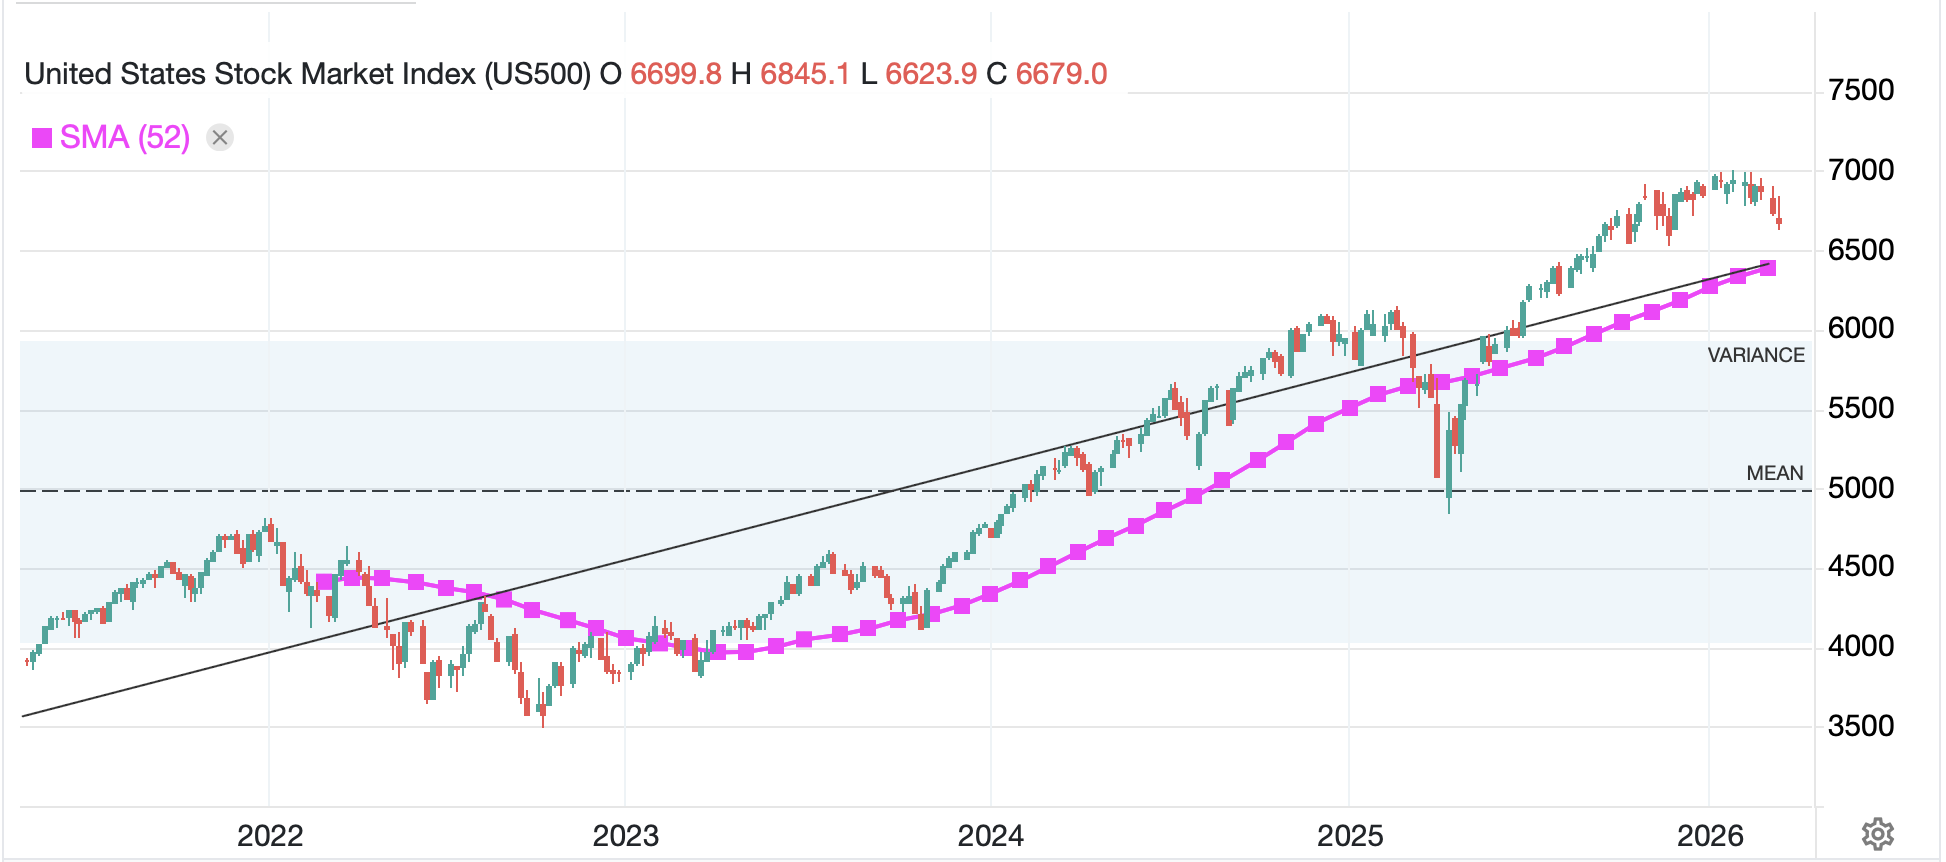
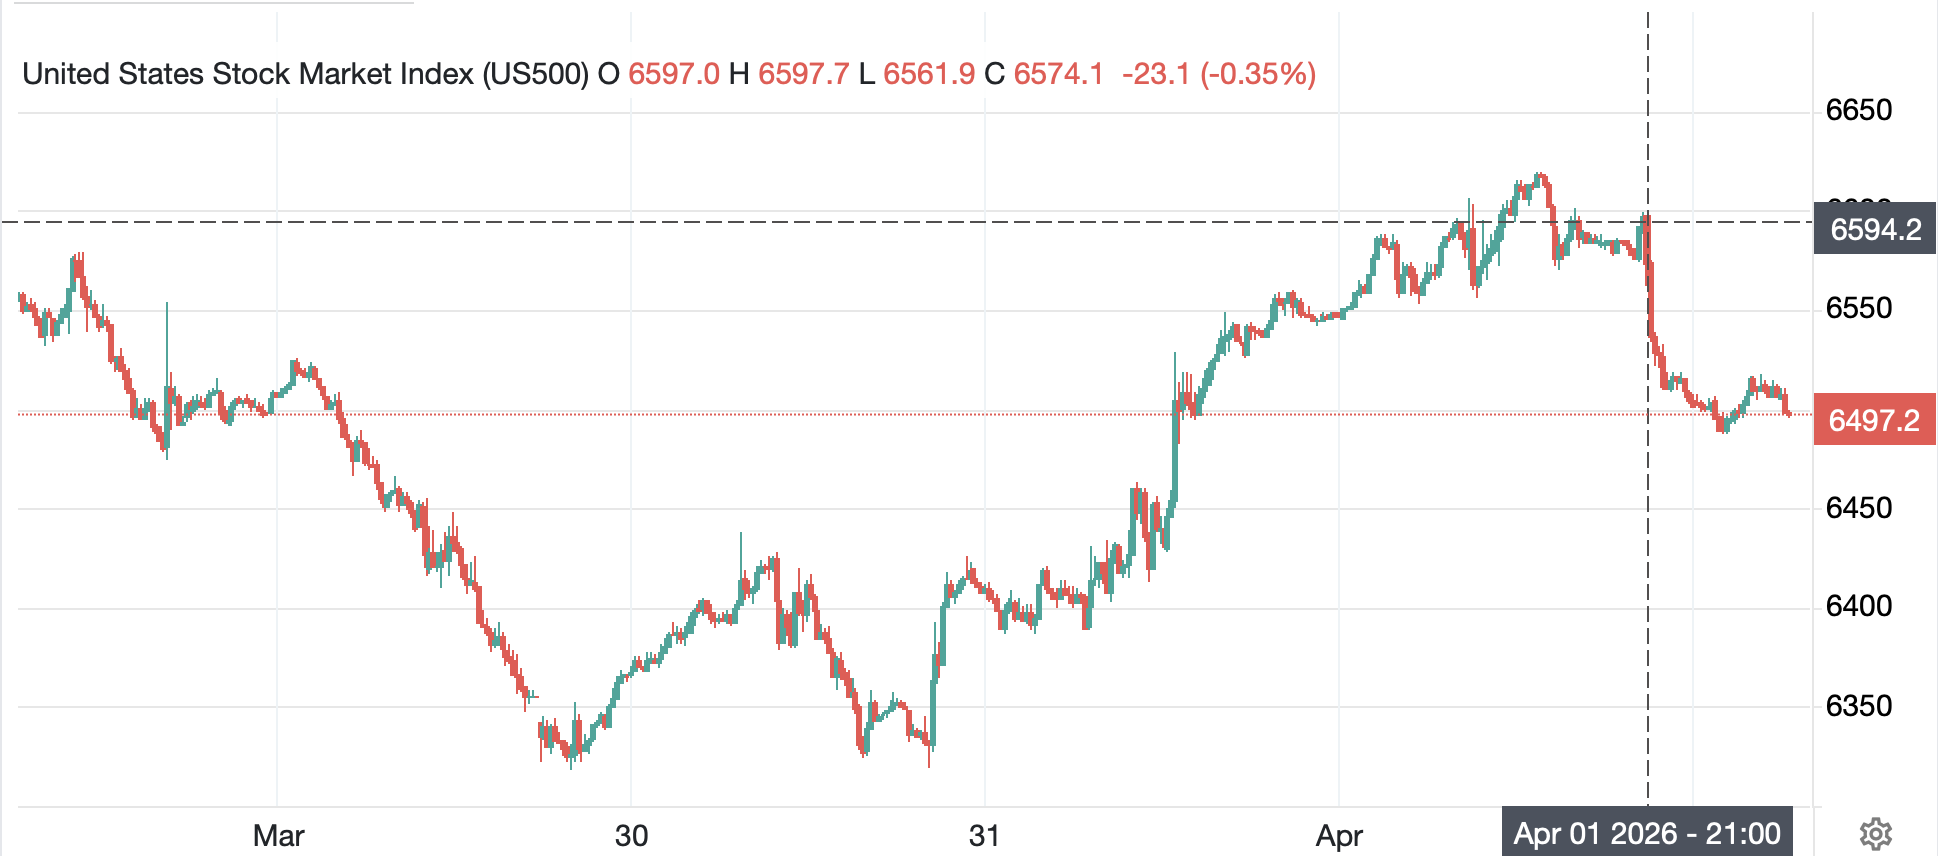
He also explained that the rising gasoline prices were a result of Iranian attacks on tankers but that the US was well supplied and would weather any storm in the short run with no problems. However, this is not what markets were looking for, that is very clear. So, the past two days of rainbows and unicorns are a distant memory this morning. A look at the chart of the S&P 500 below shows the end of last week’s concerns grew into optimism right up until 9:00pm EDT last night when Mr Trump took to the podium.
Source: tradingeconomics.com
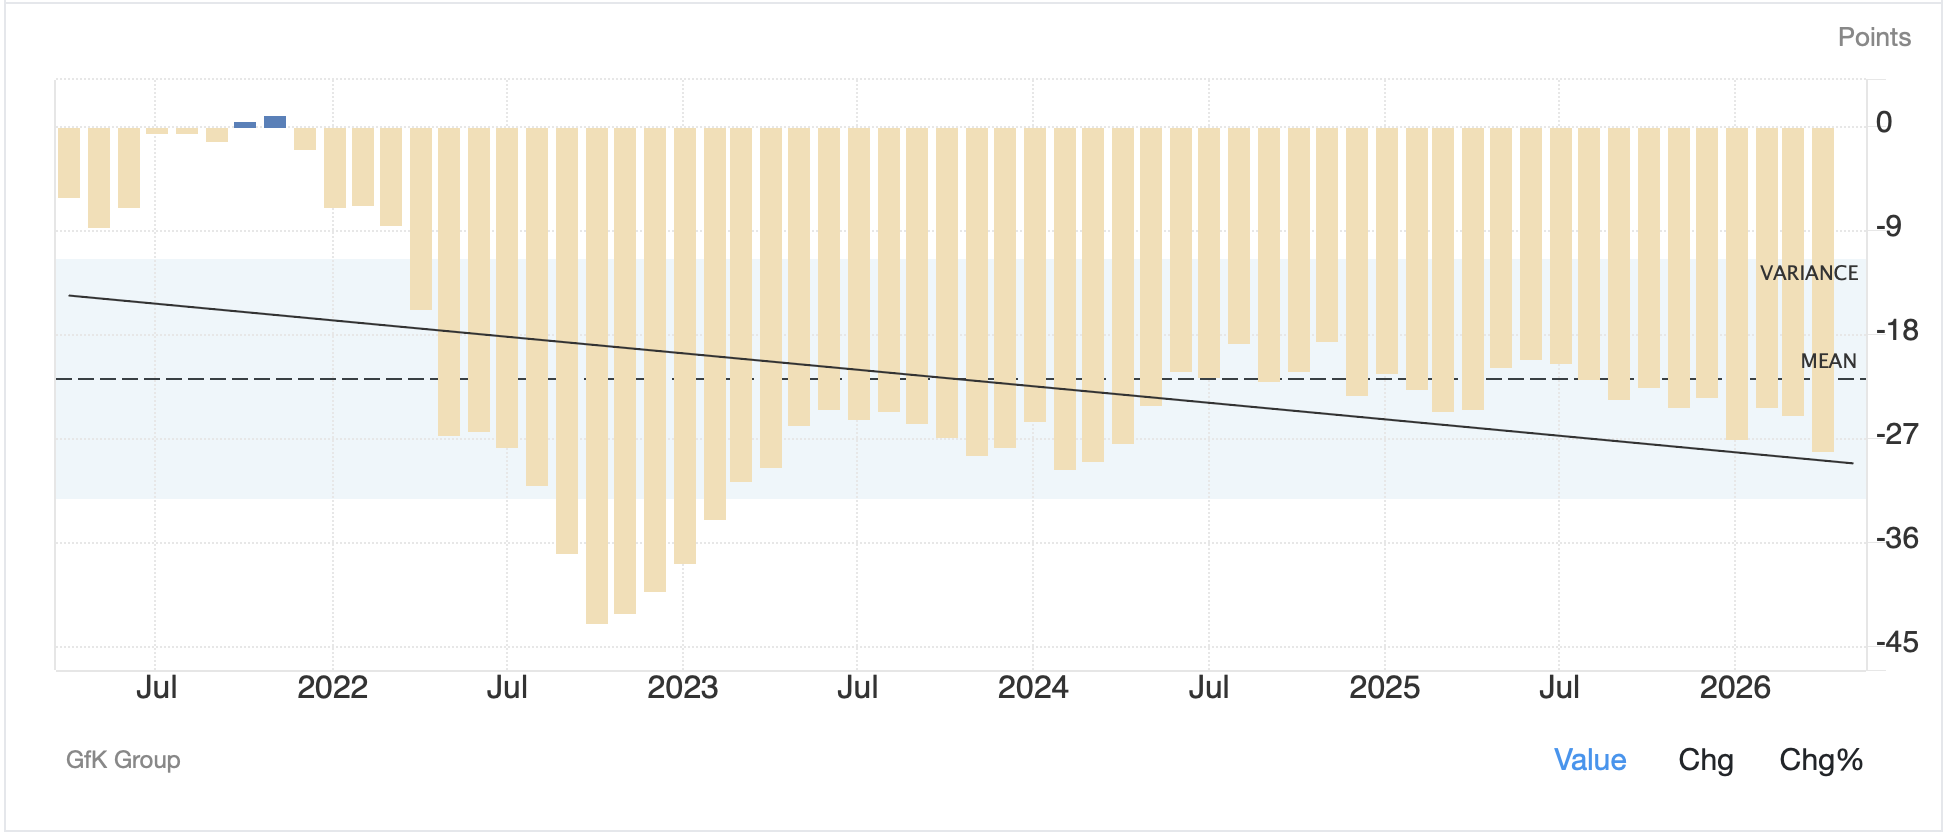
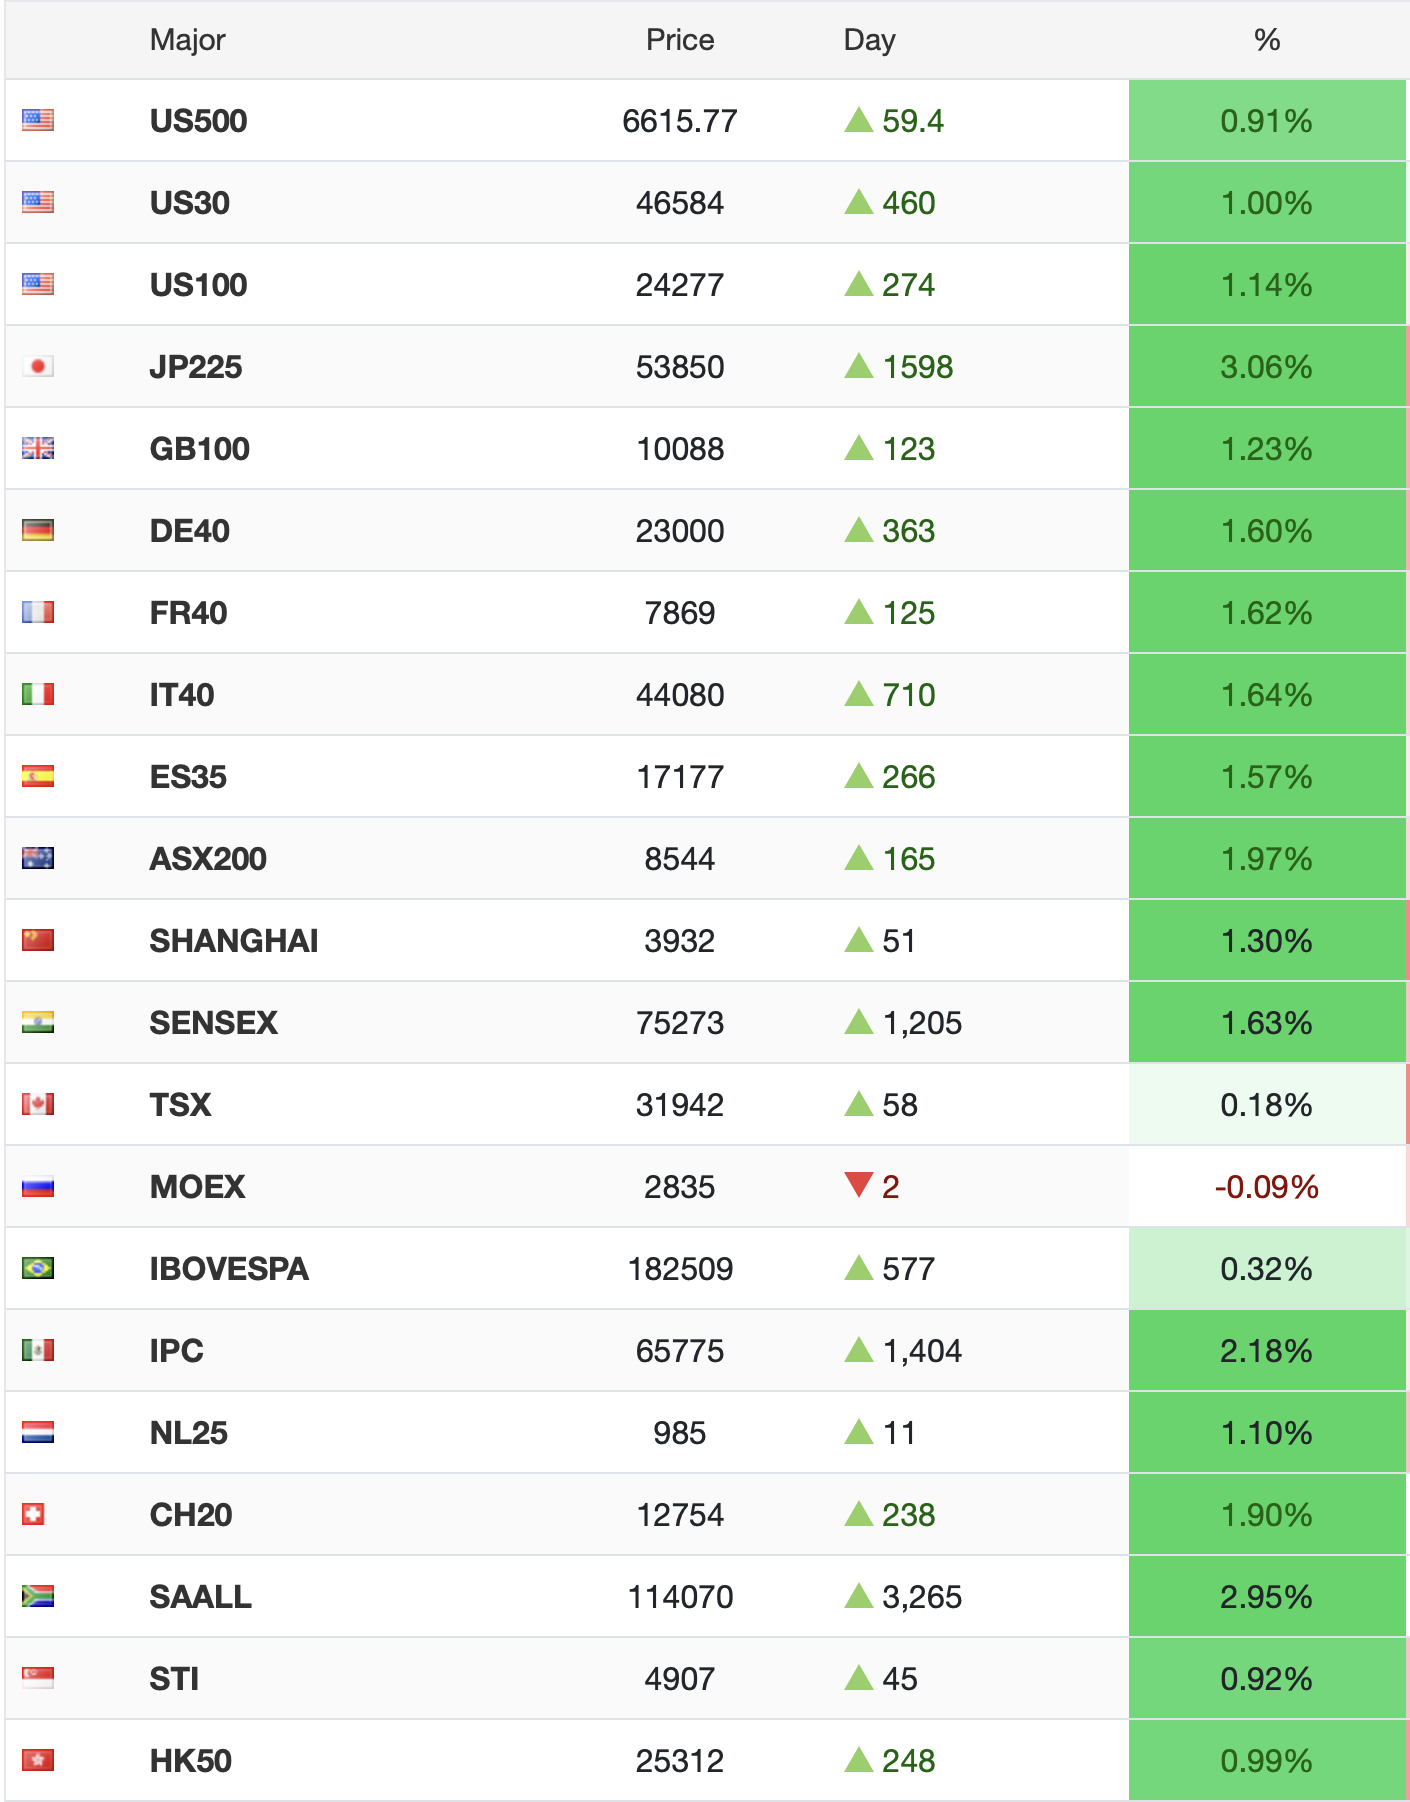
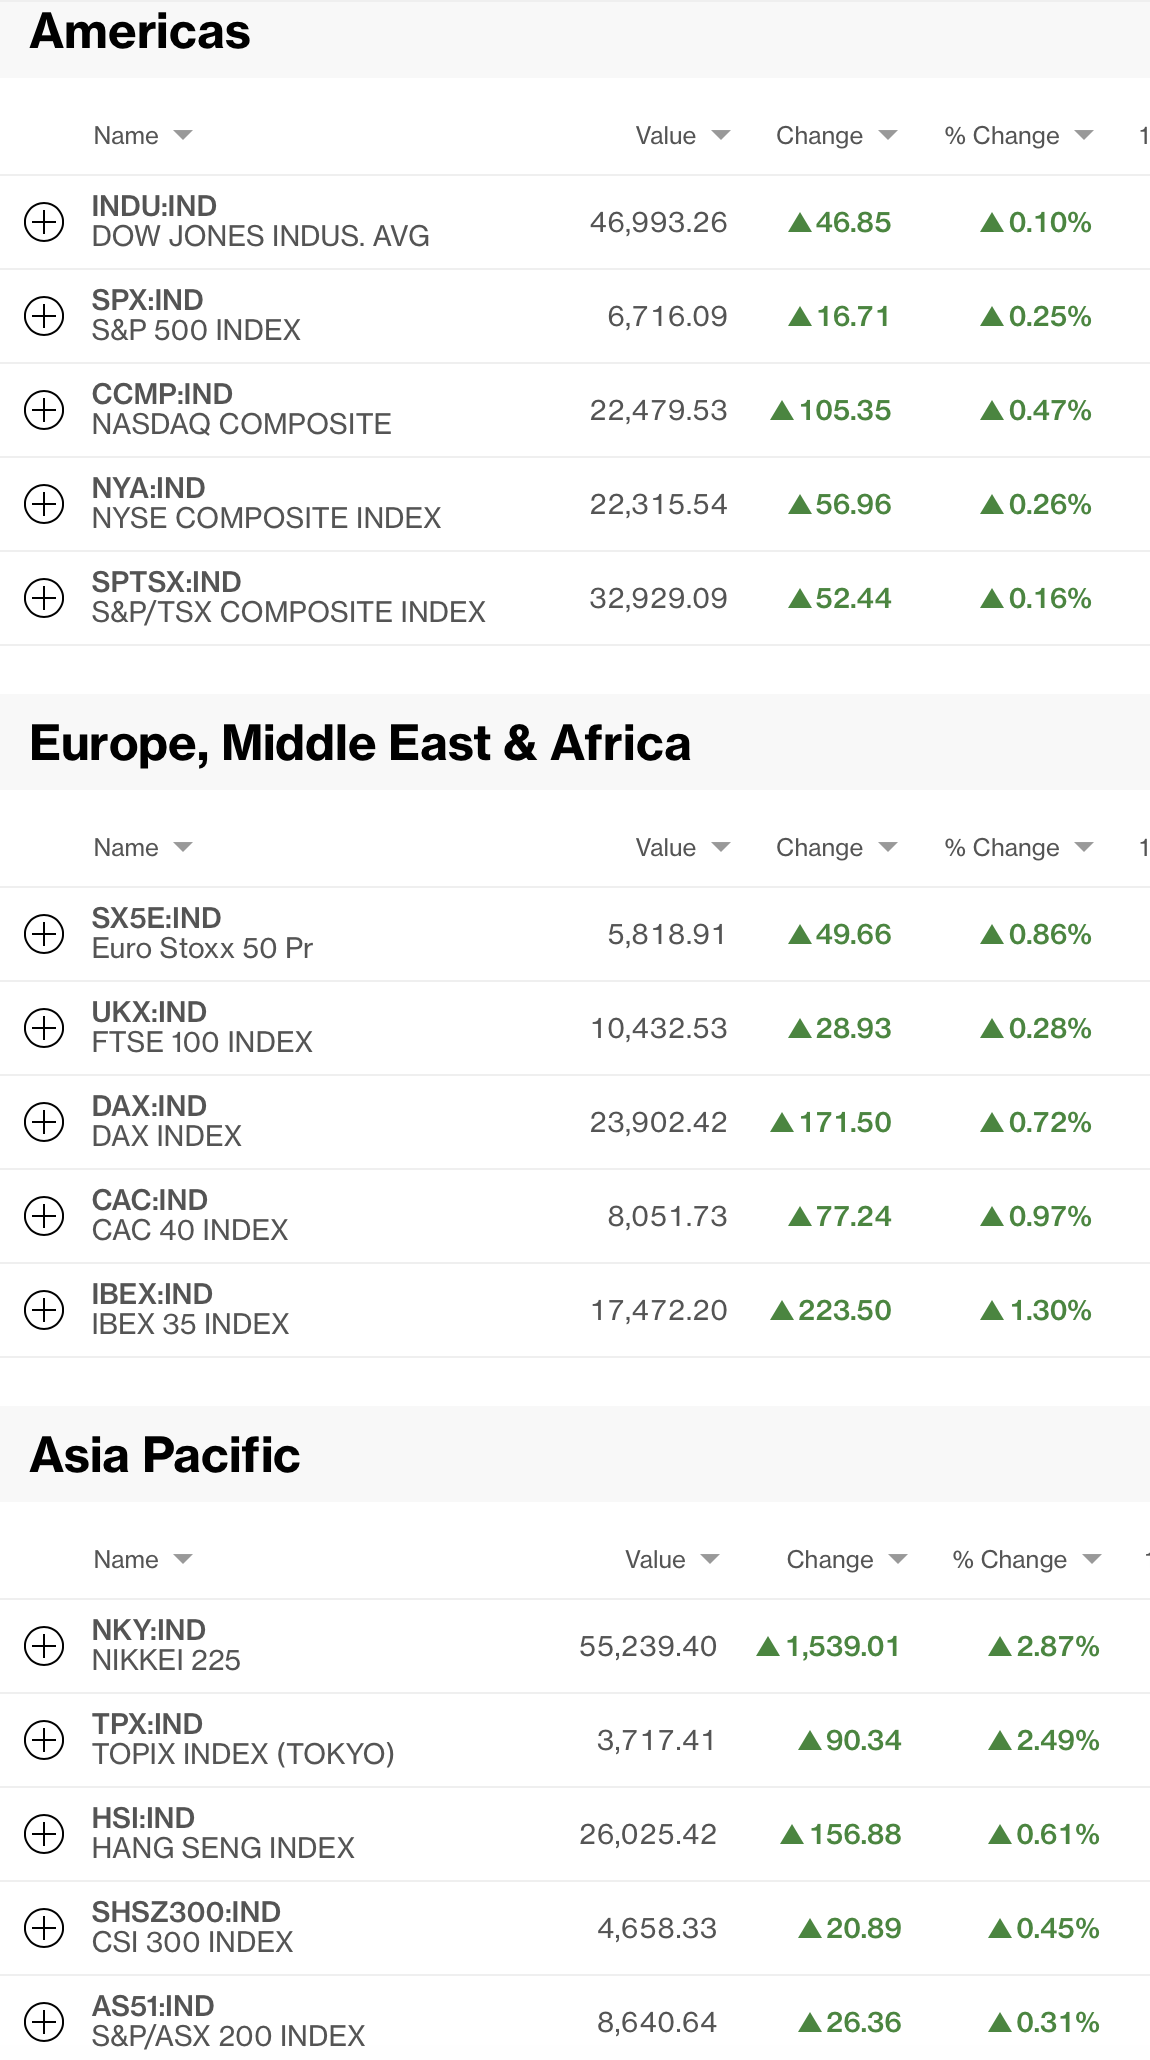
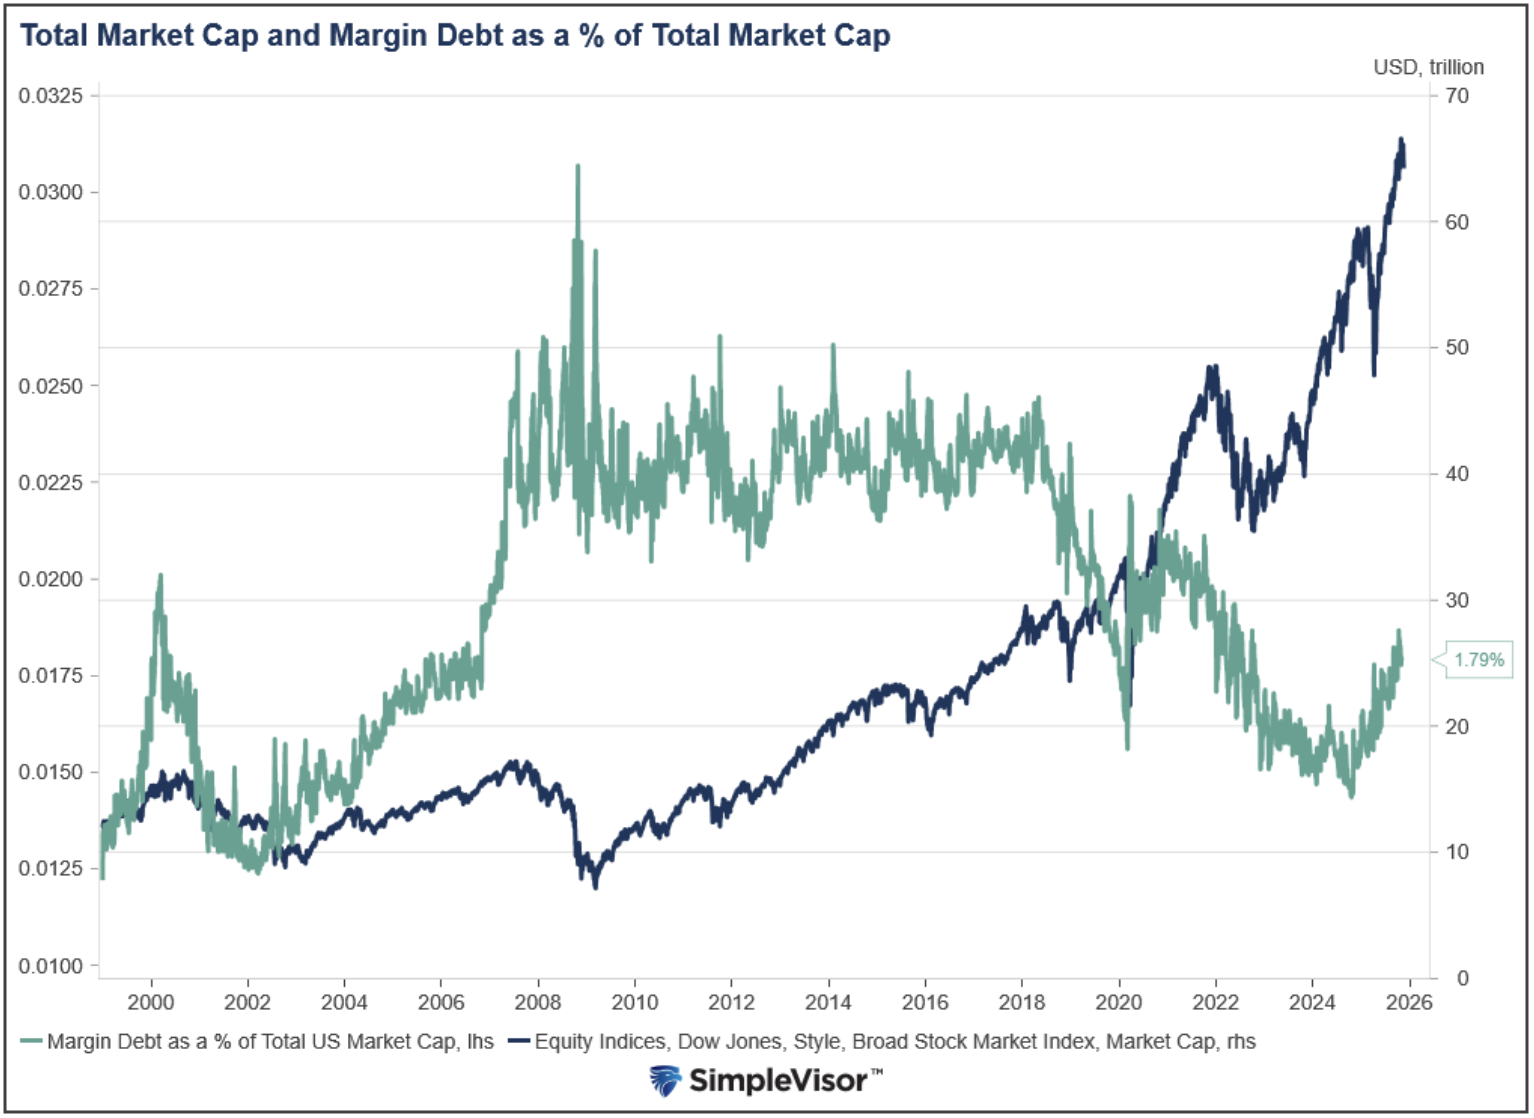
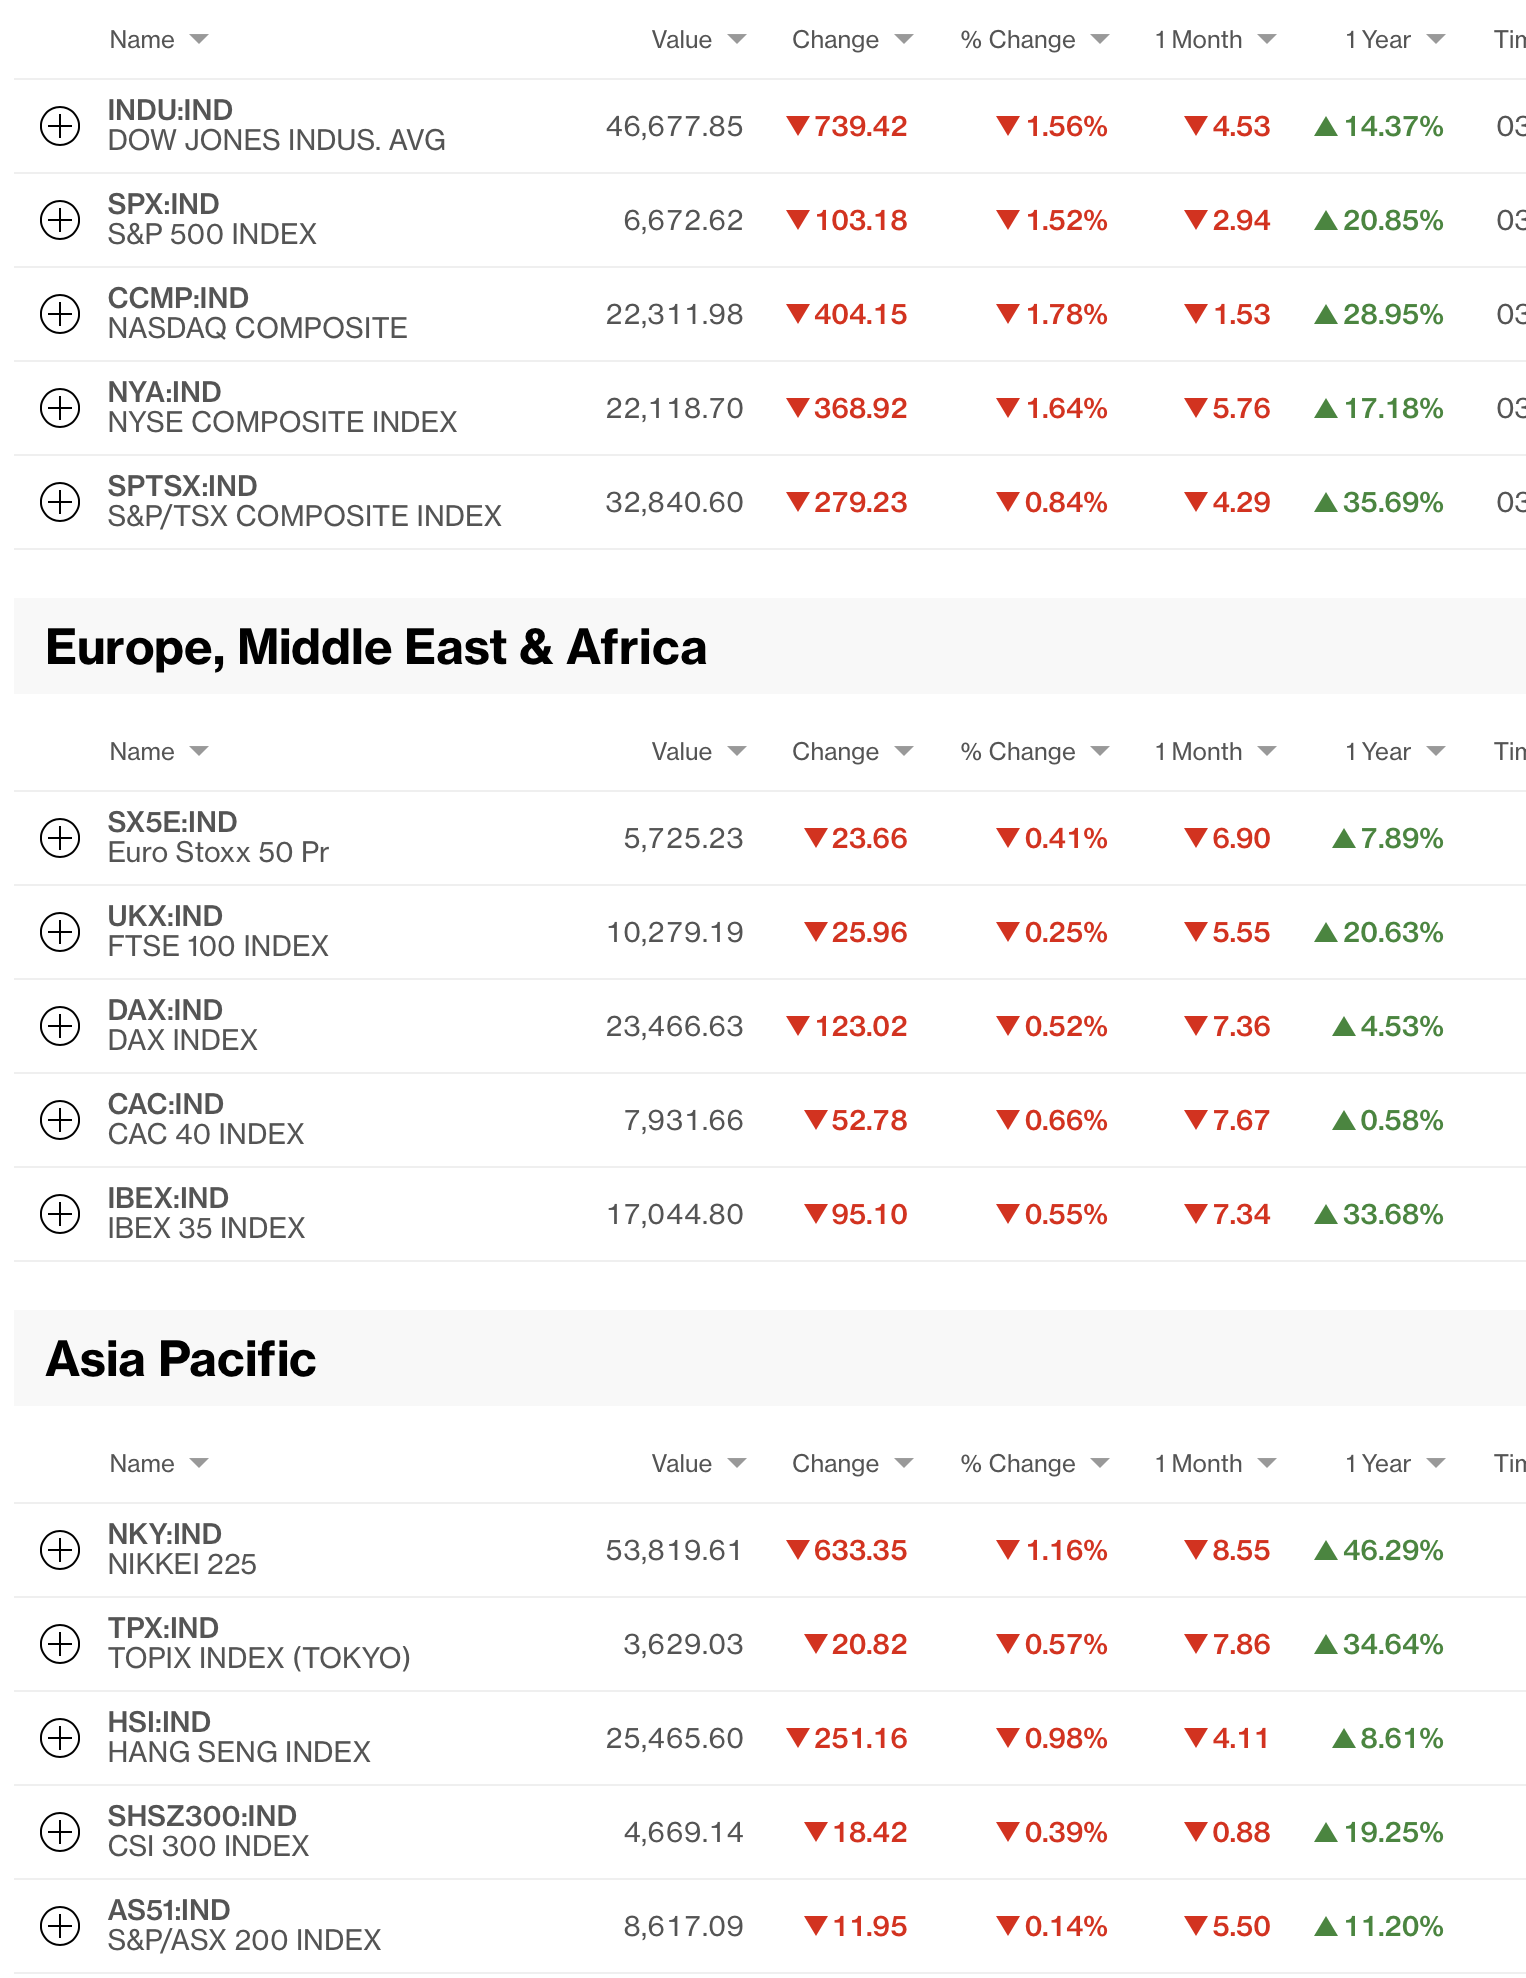
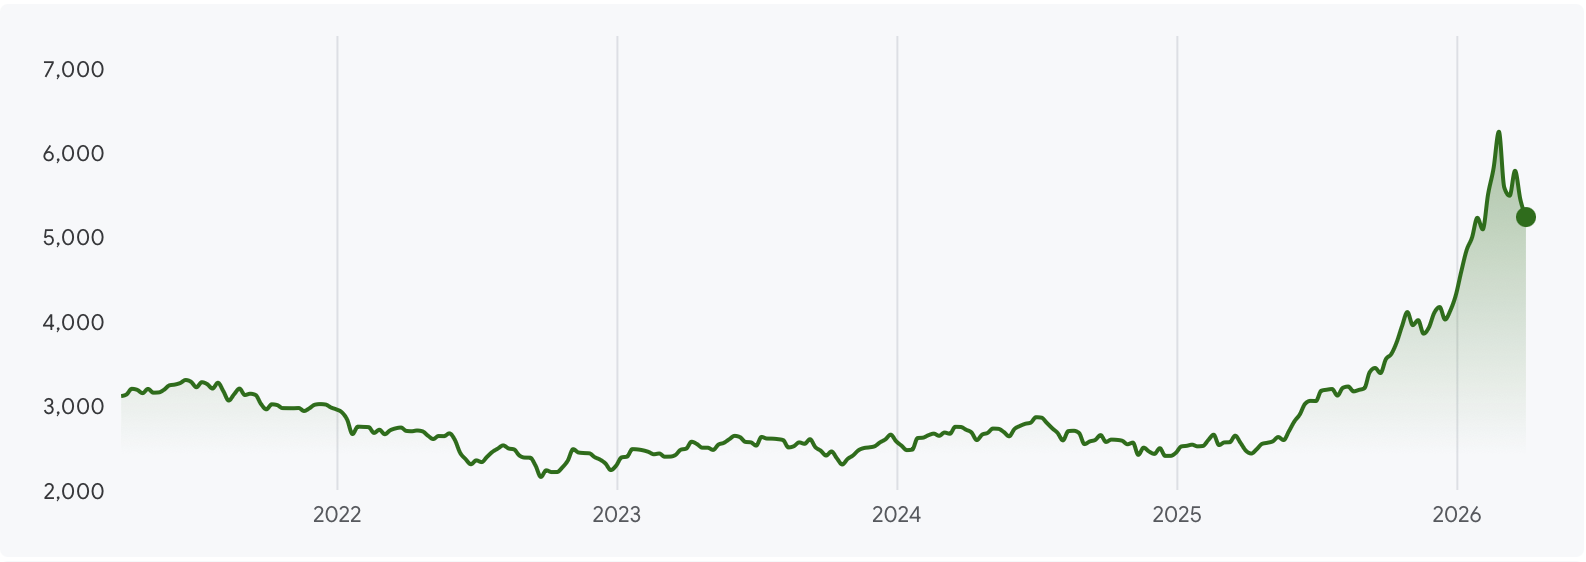
While futures are only lower by -1.0% at this hour (6:30), the response in both Asia and Europe was quite negative overall. For instance, in Asia, Tokyo (-2.4%) led the way lower although weakness was virtually universal (China -1.0%, HK -0.7%, Australia -1.1%, Taiwan -1.8%) while the biggest loser was Korea (-4.5%) which has been in the process of unwinding what appears to have been a massive bubble there as per the below chart.
Source: google.com
European bourses are also lower across the board with the UK (-0.1%) the clear winner (least bad?), while the continental exchanges (Germany -1.85%, Spain -1.3%, Italy -1.2% and France -0.9%) are all faring poorly this morning. It is very clear that the idea the war would be ending soon has been pushed back. I have to say, that given the ongoing buildup in military assets in the Gulf region by the US, that always struck me as an odd belief. I guess we will need to wait a few more days/weeks to see.
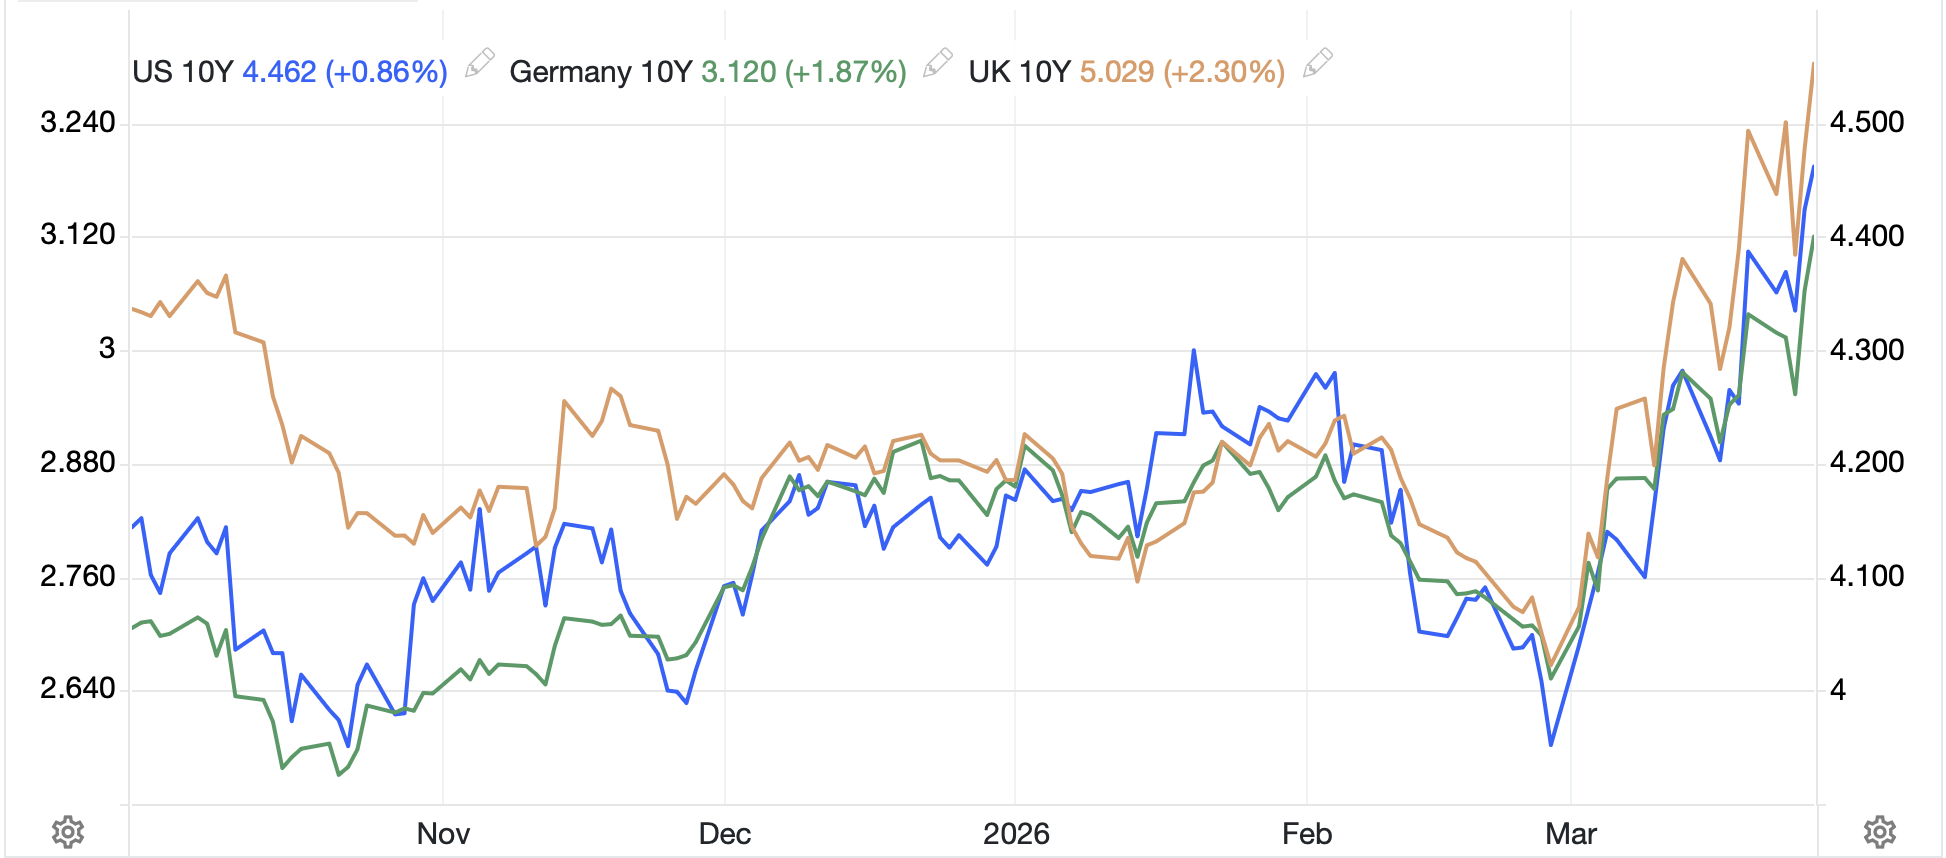
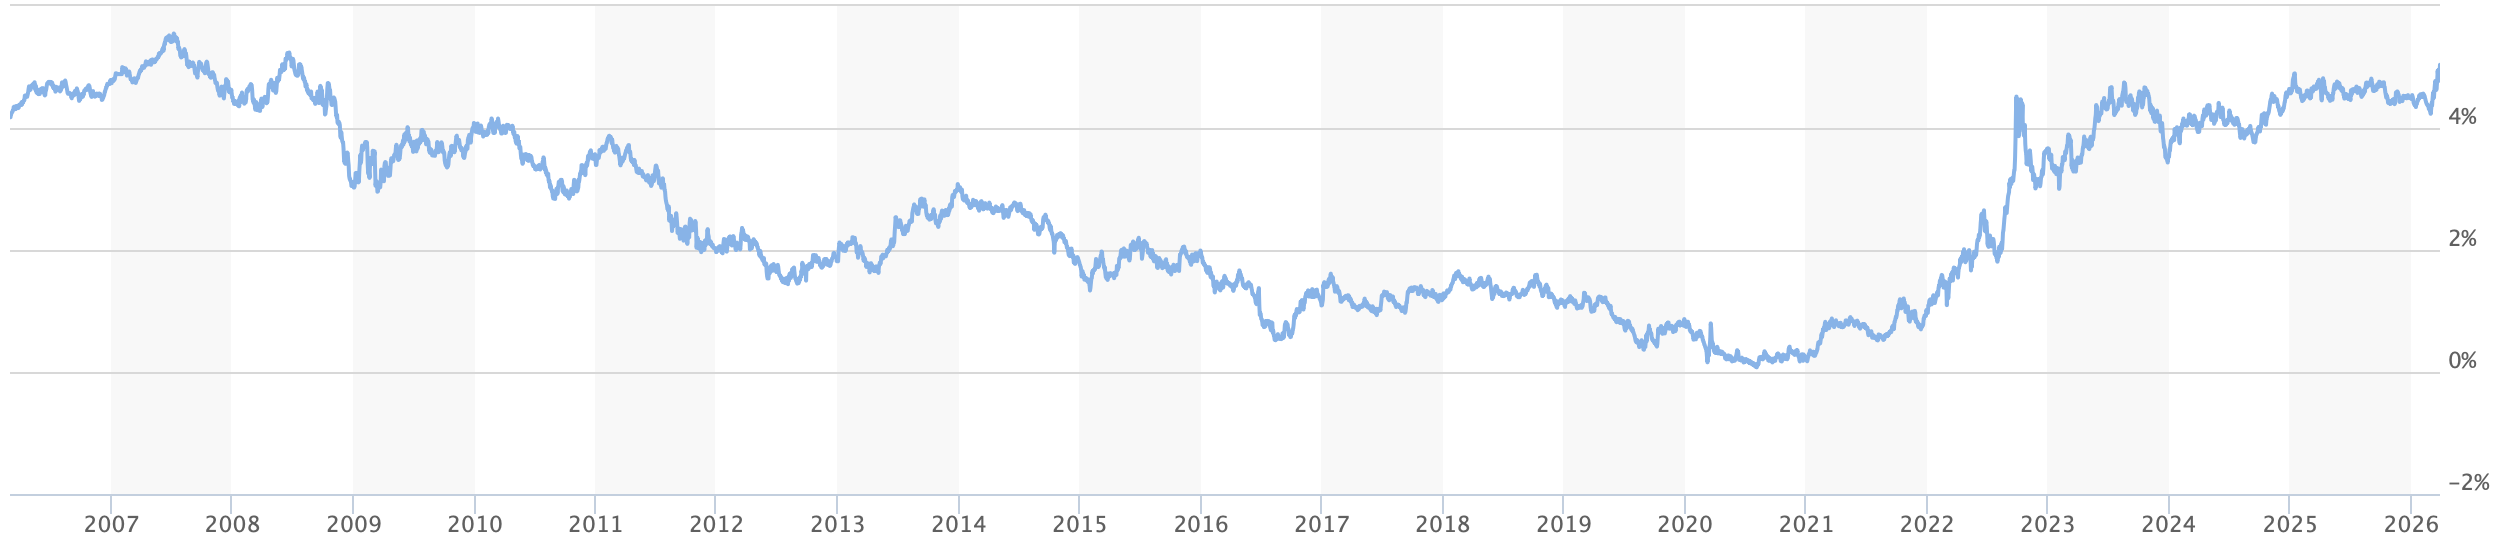
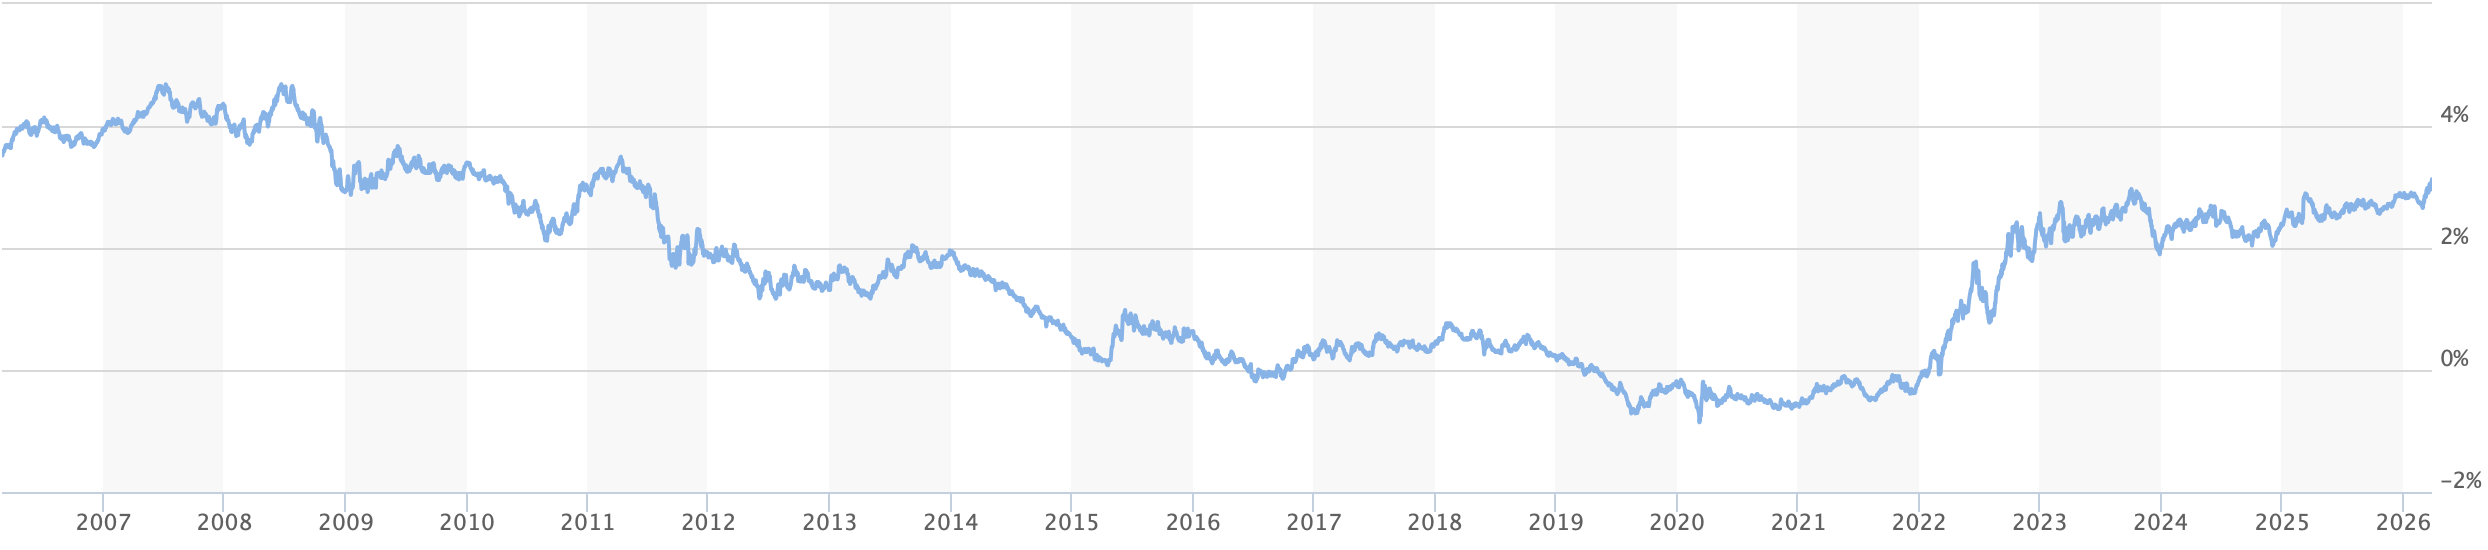
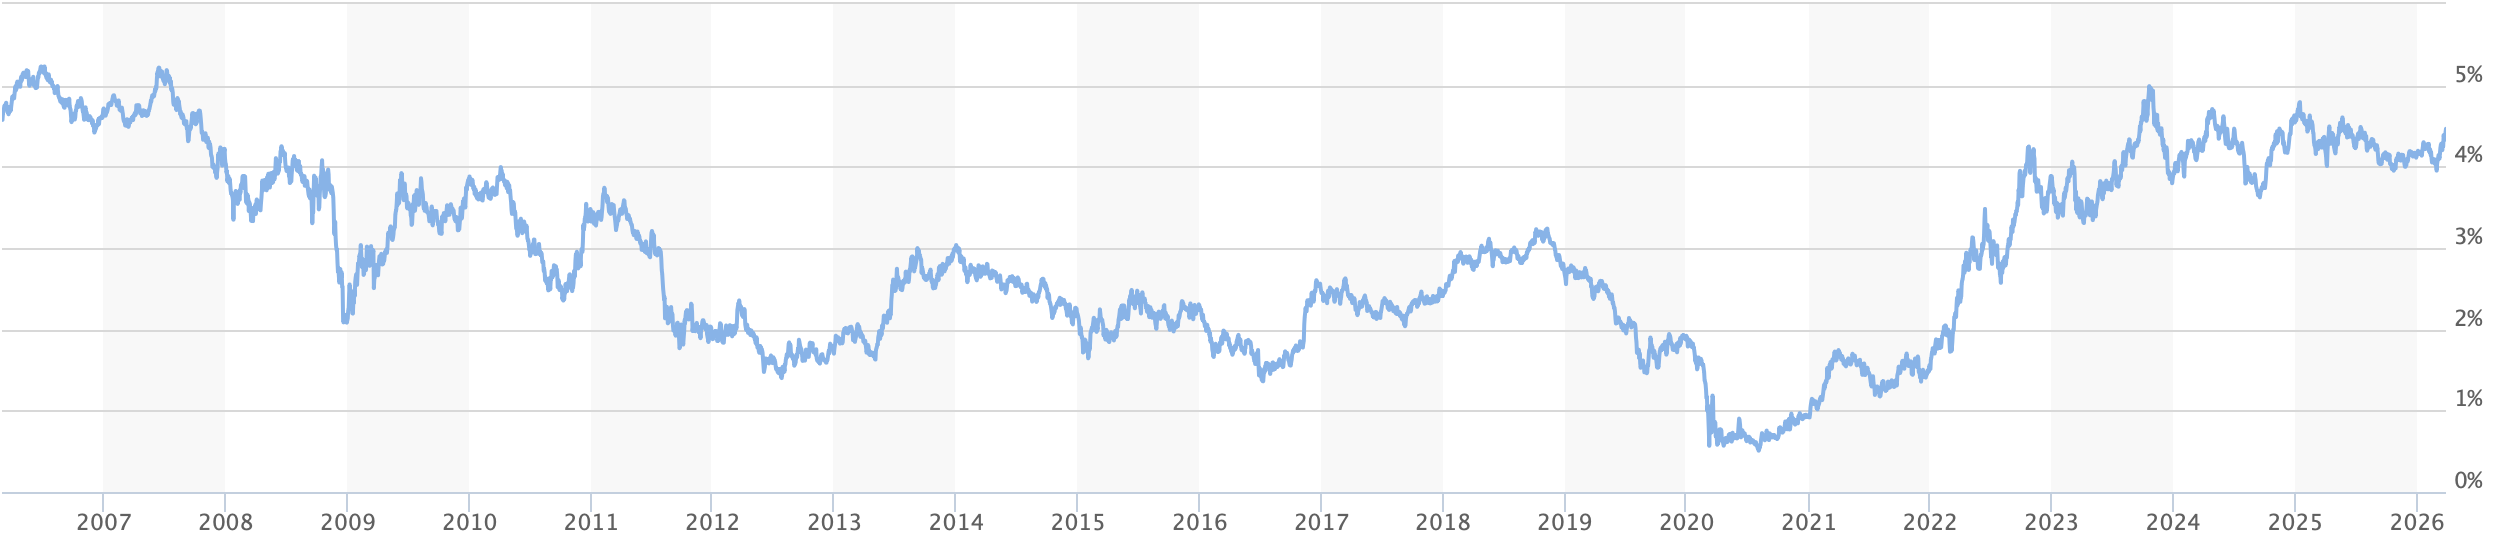
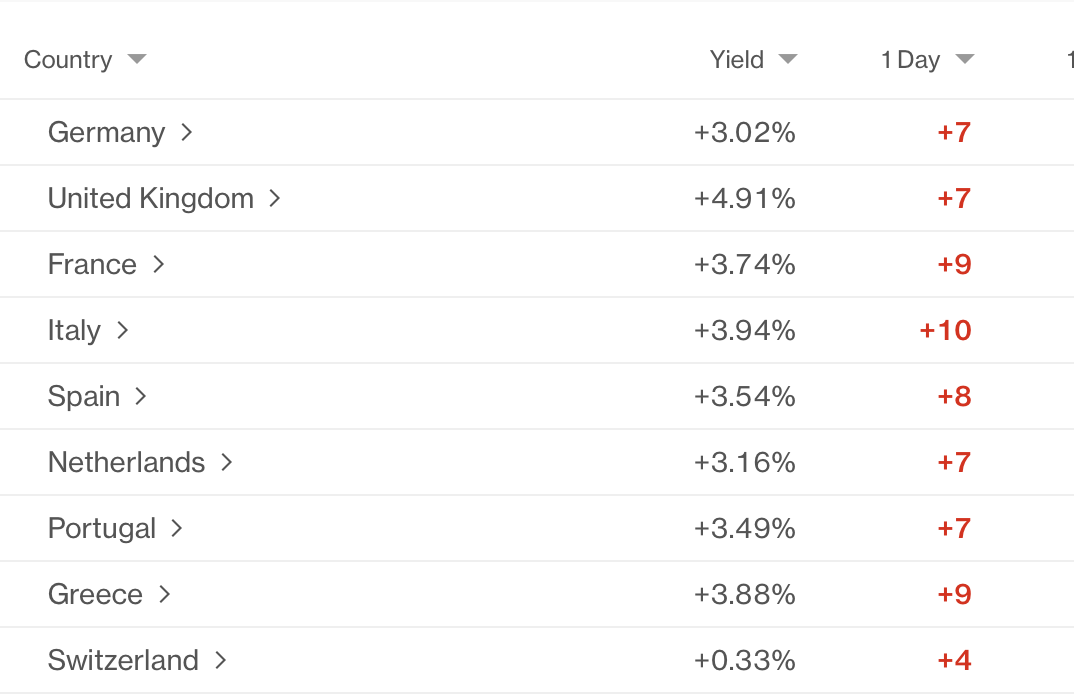
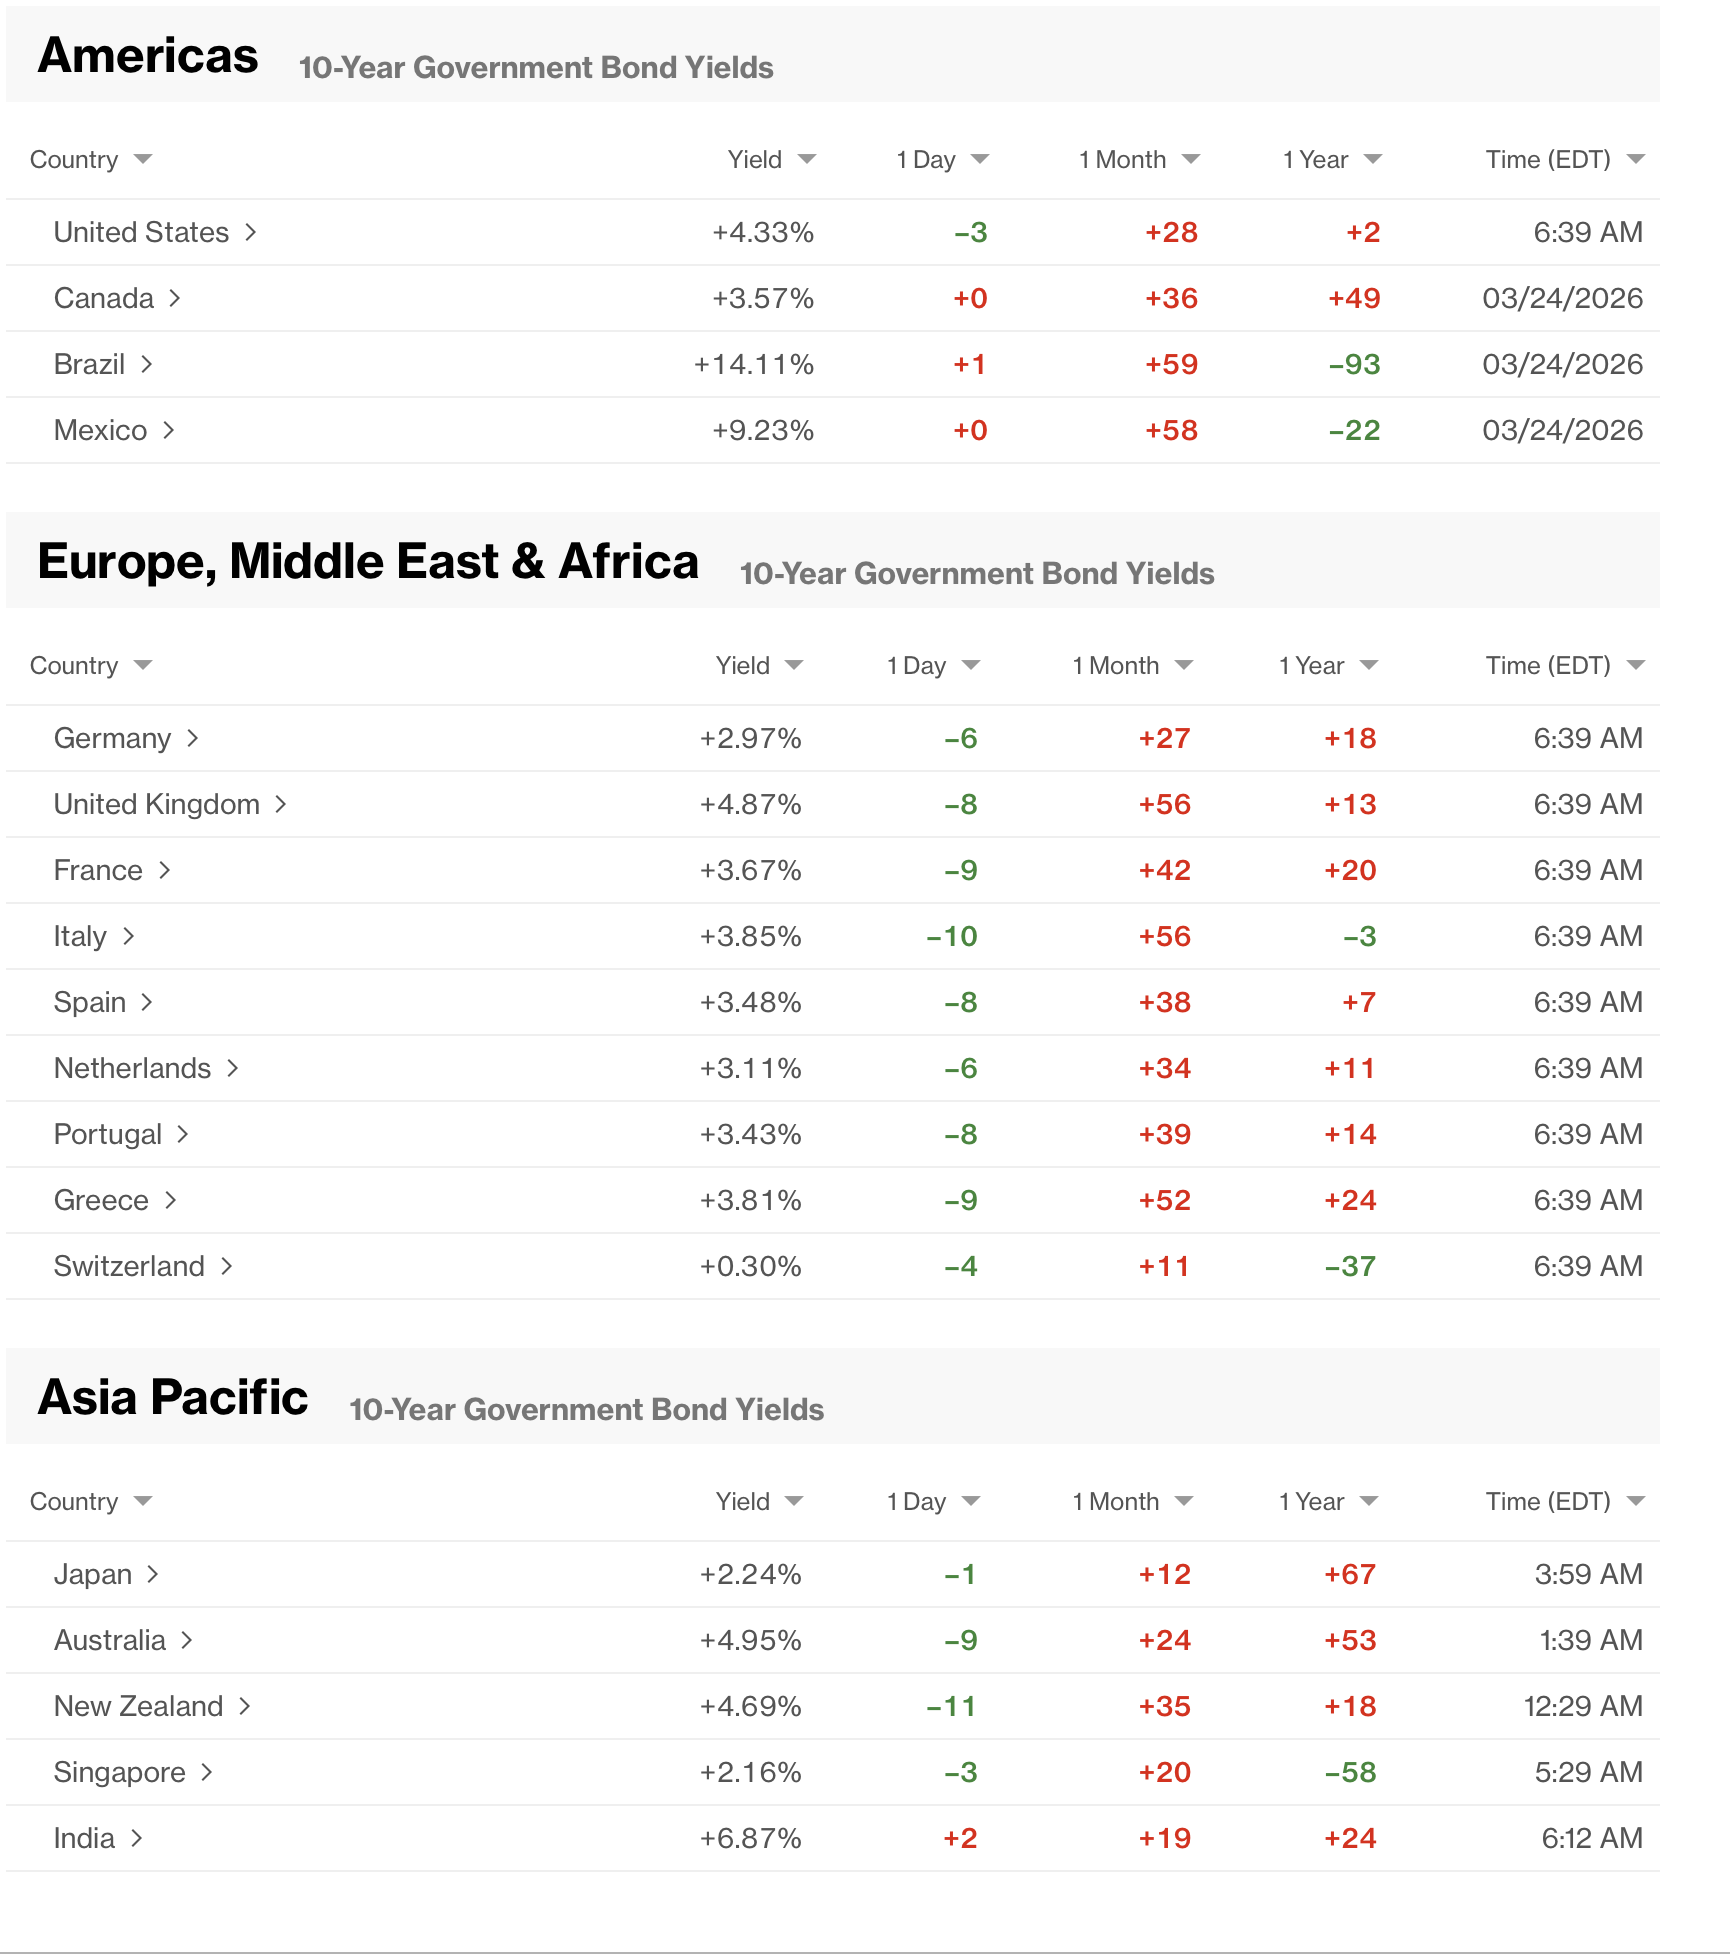
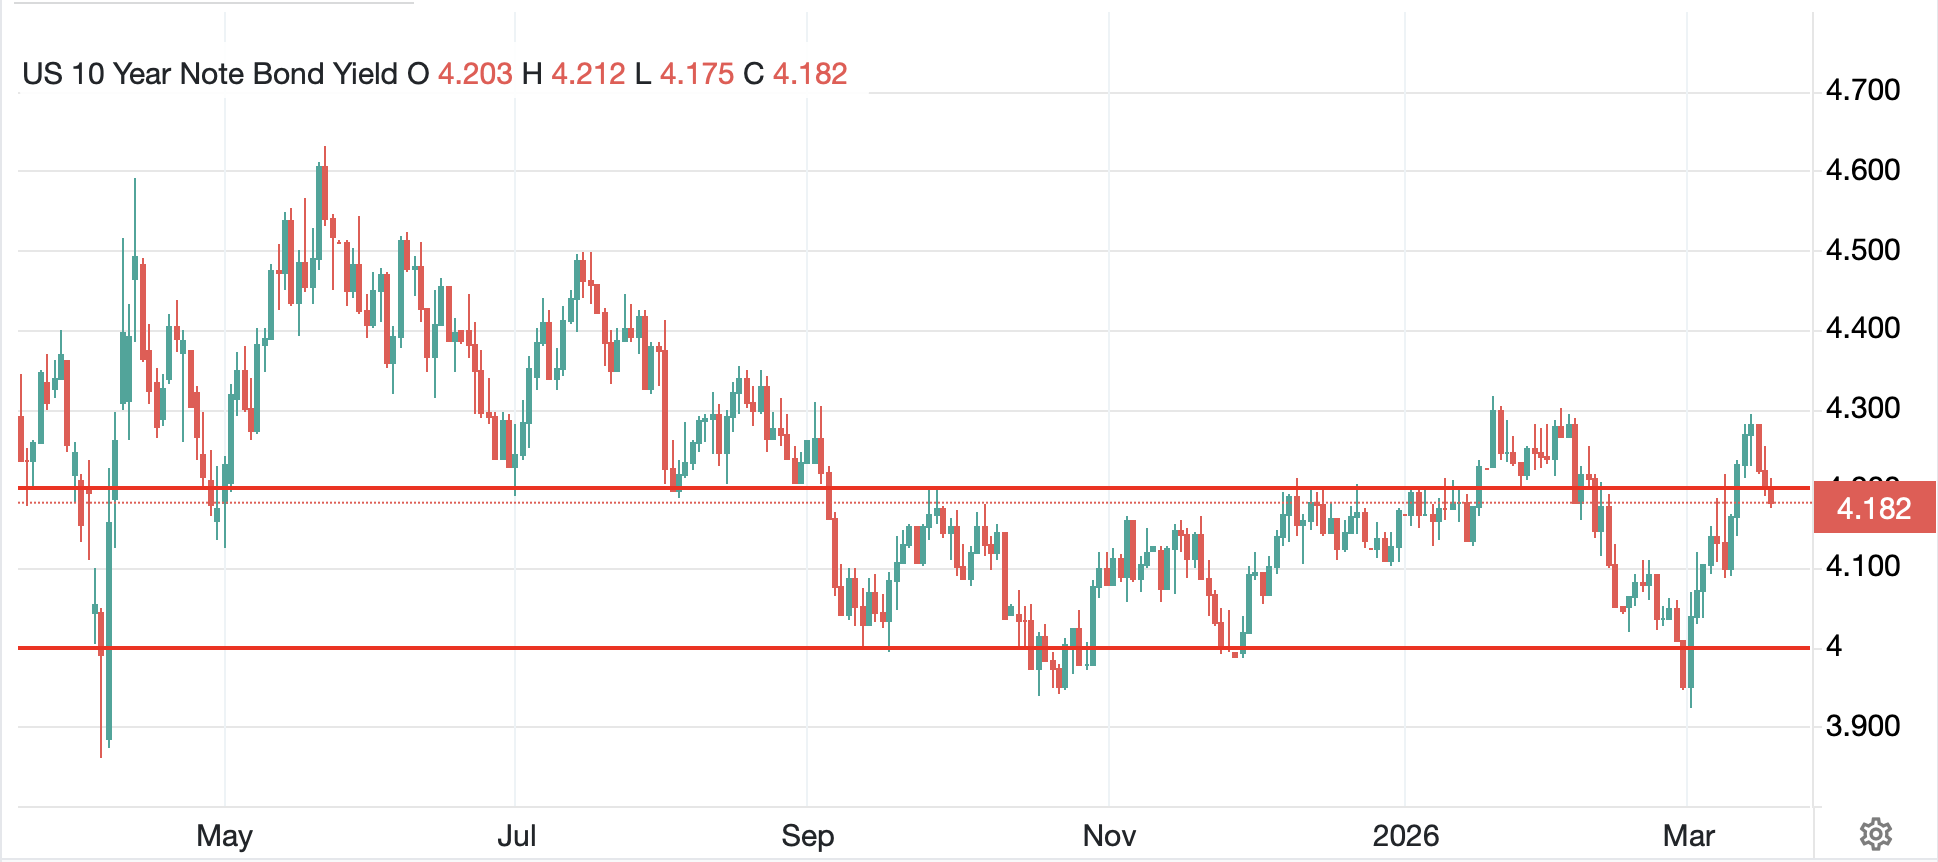
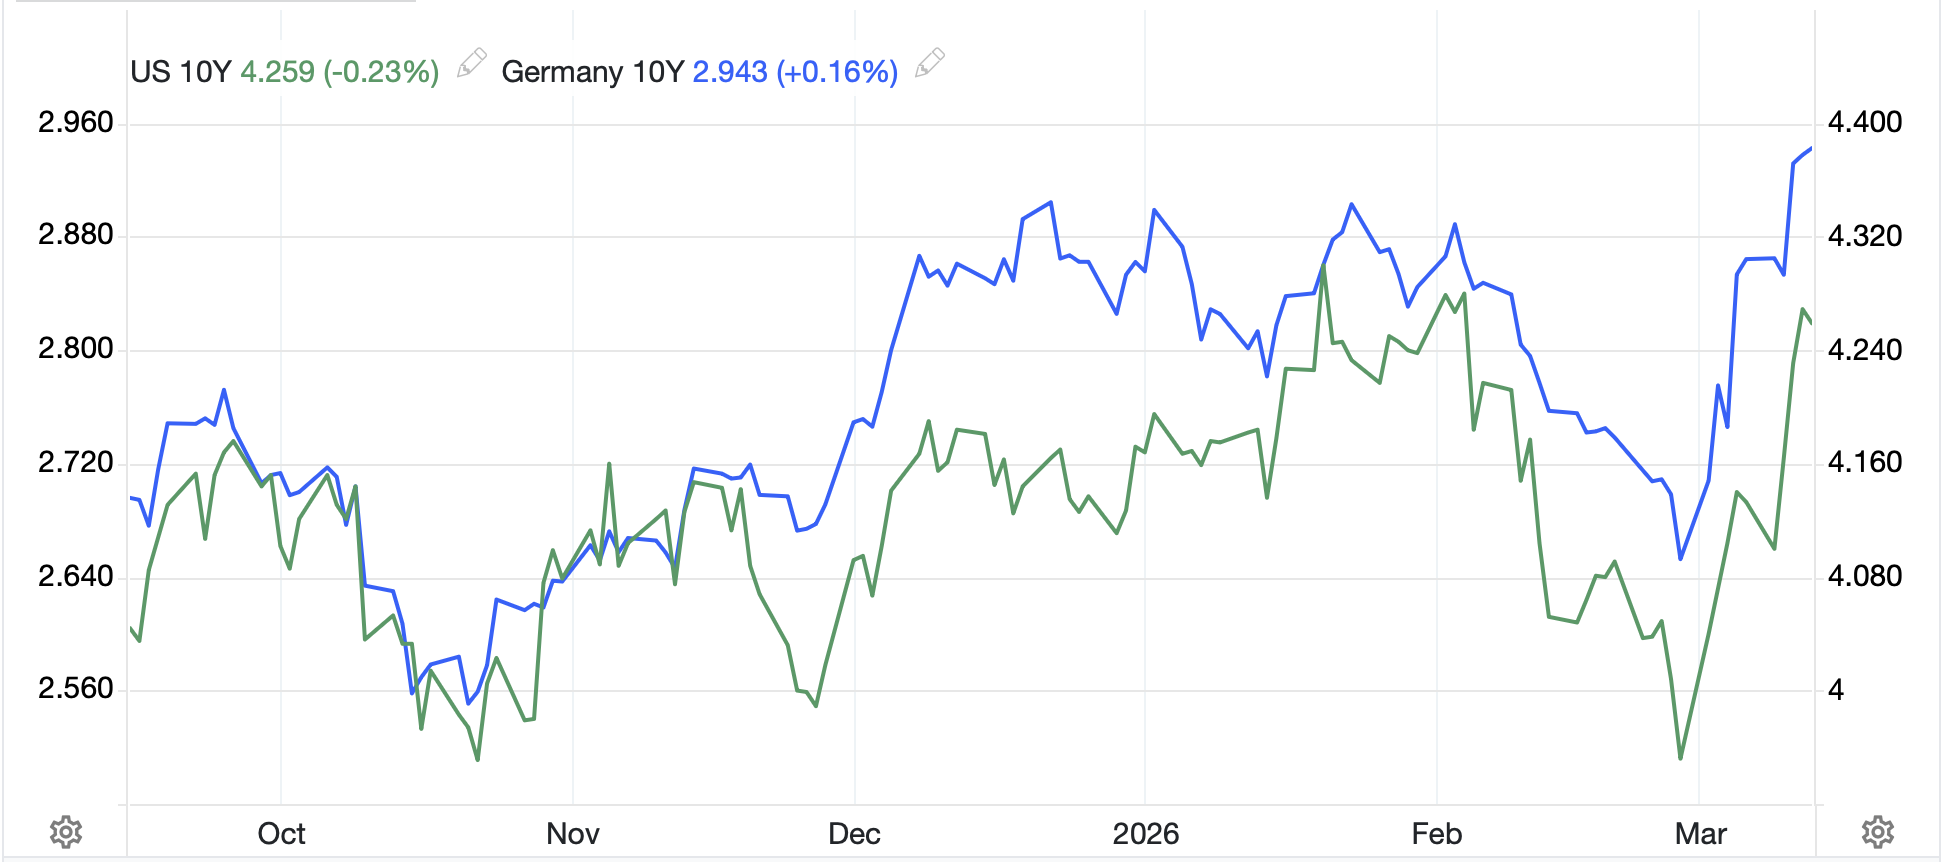
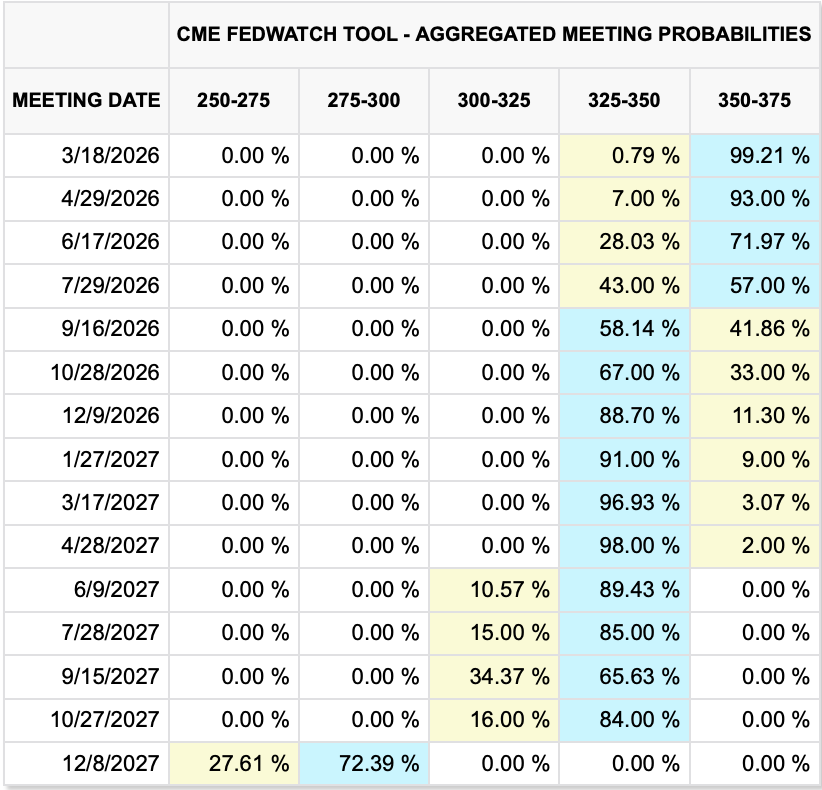
In the bond market, too, price action from the beginning of the week has reversed. Treasury yields have rebounded 5bps this morning, although remain well below the recent peak of late last week, and you can see how Europe and Asia behaved in the Bloomberg screen shot below.
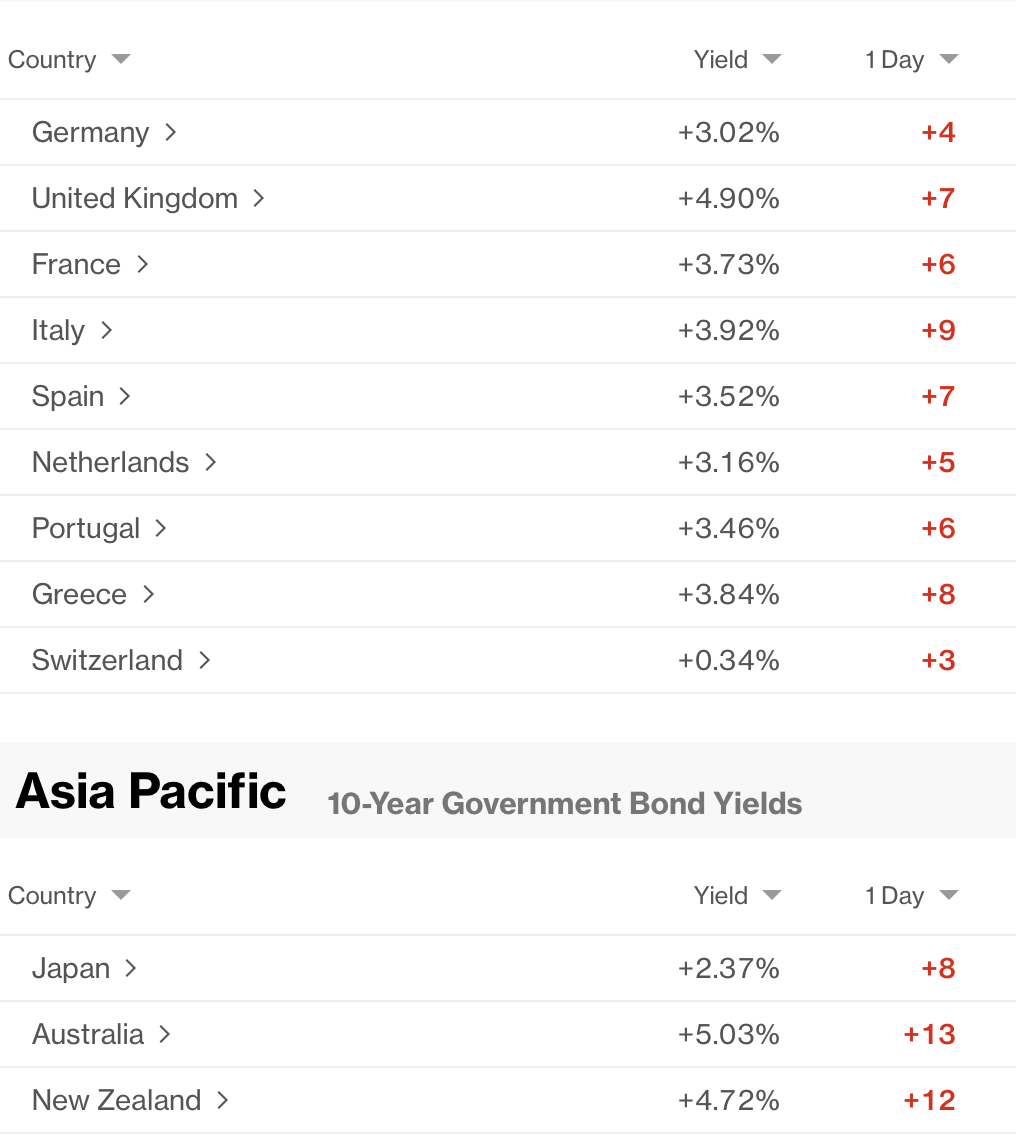
I expect that we will continue to unwind the price action from the early part of this week as the situation appears far closer to the market beliefs of last Friday than yesterday.
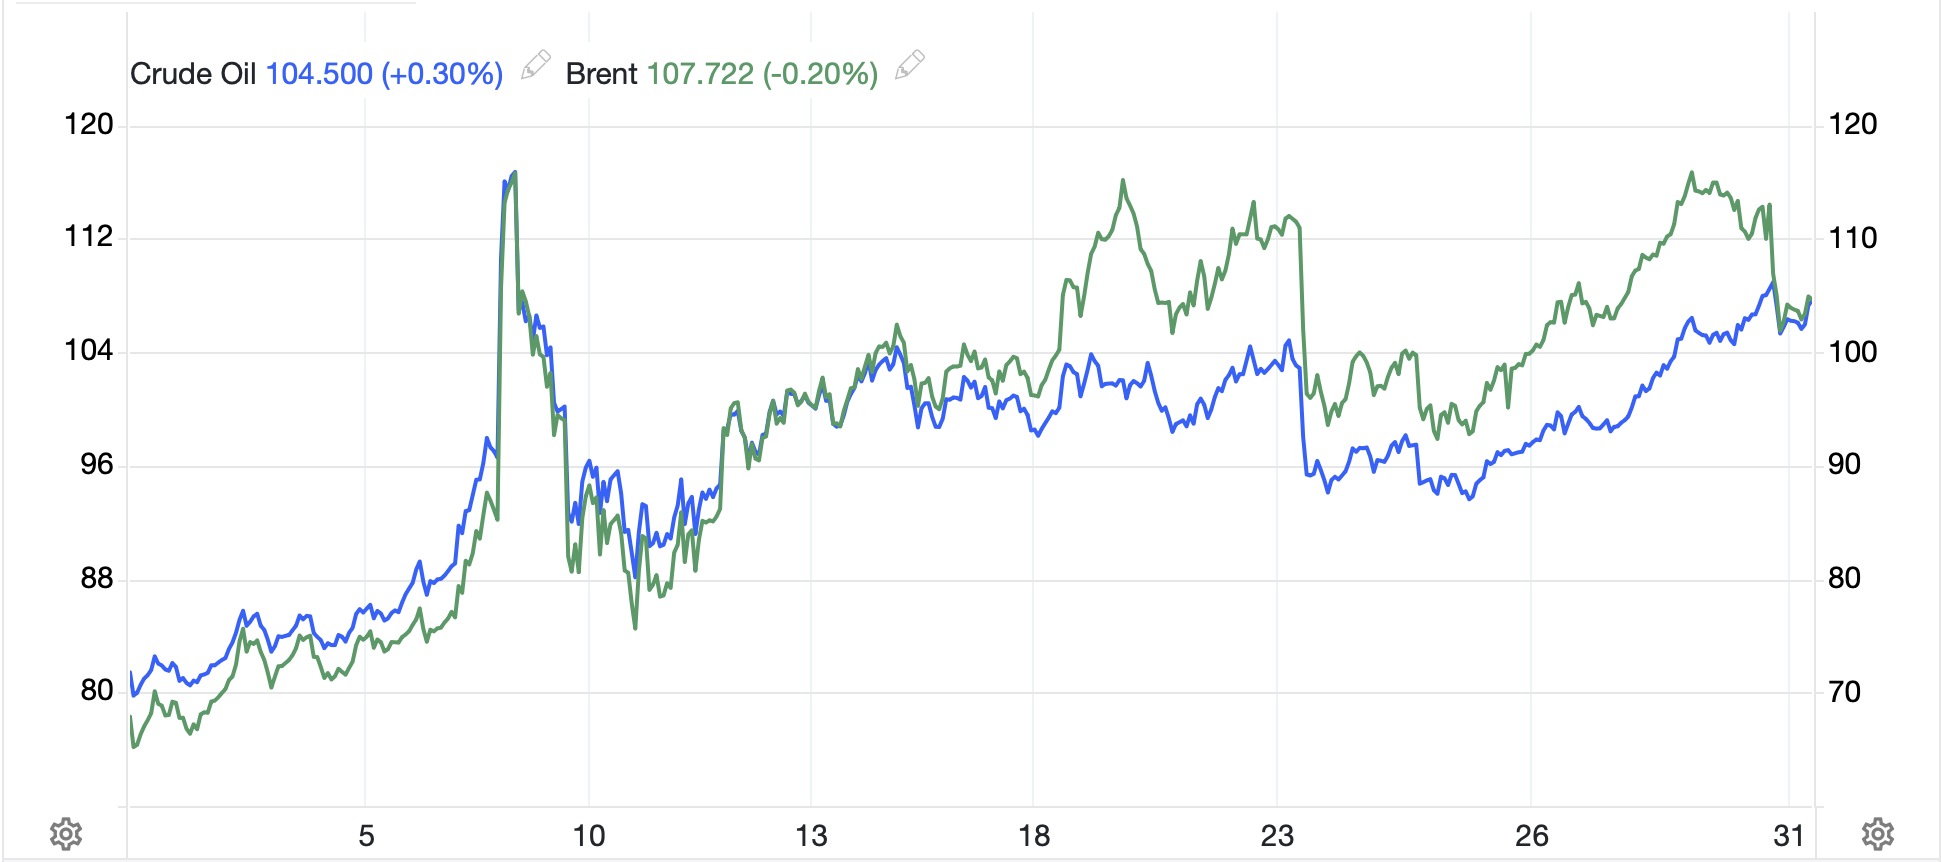
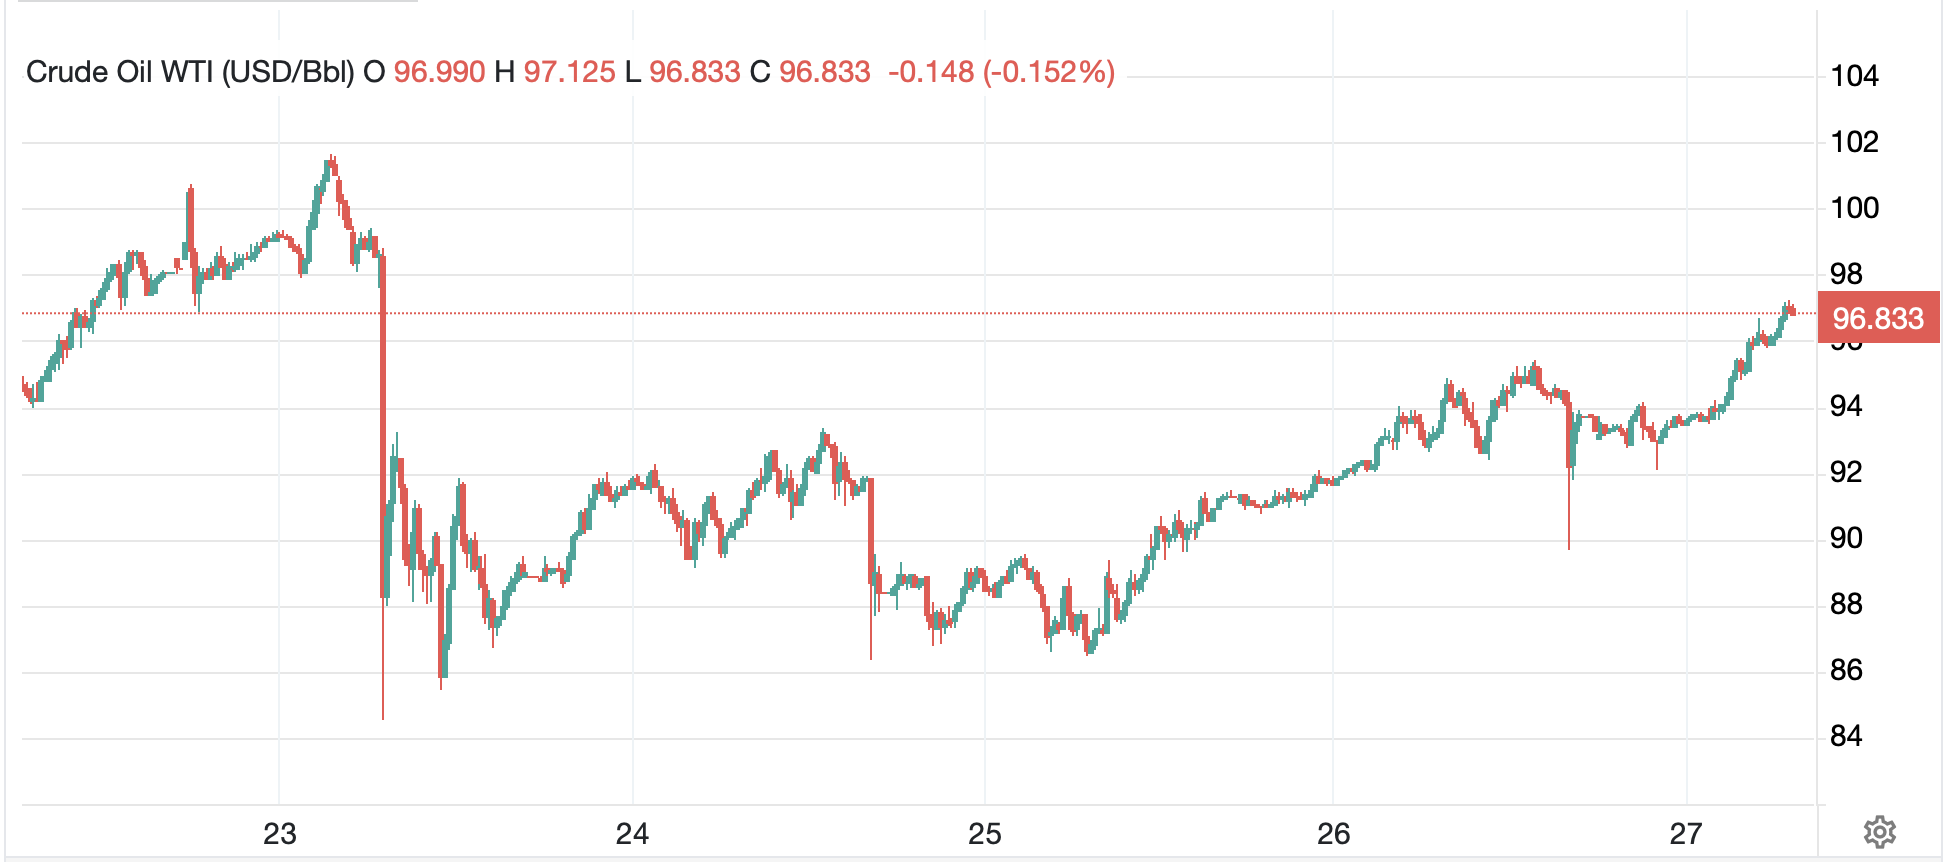
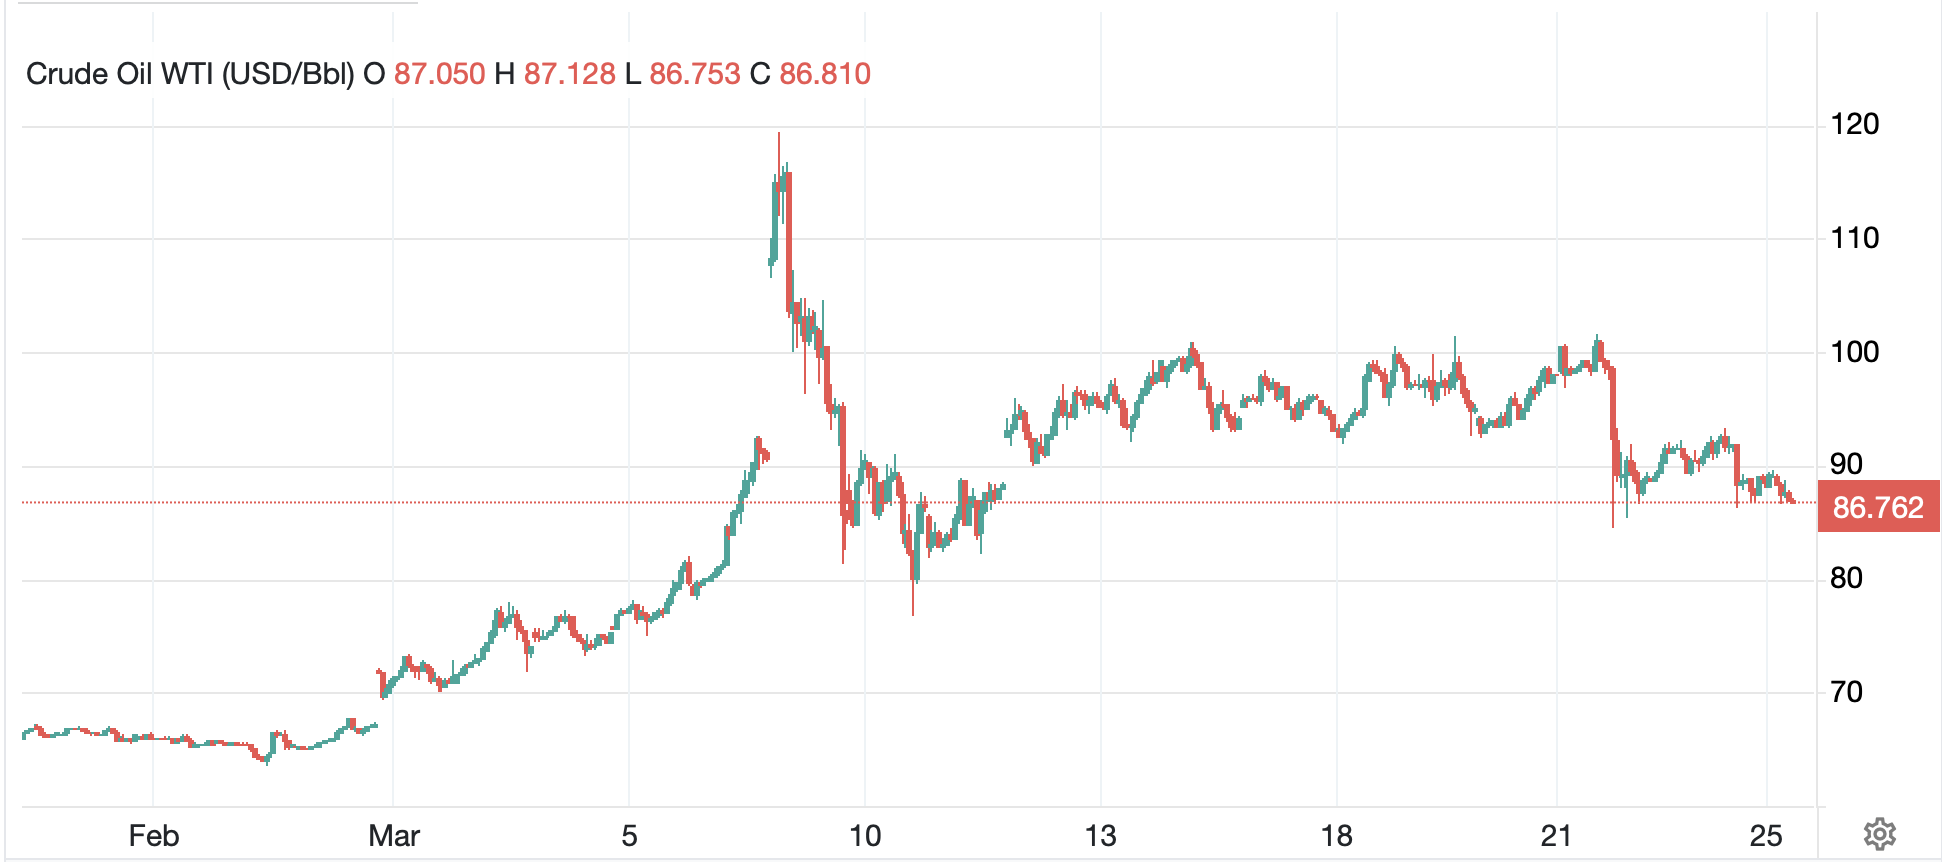
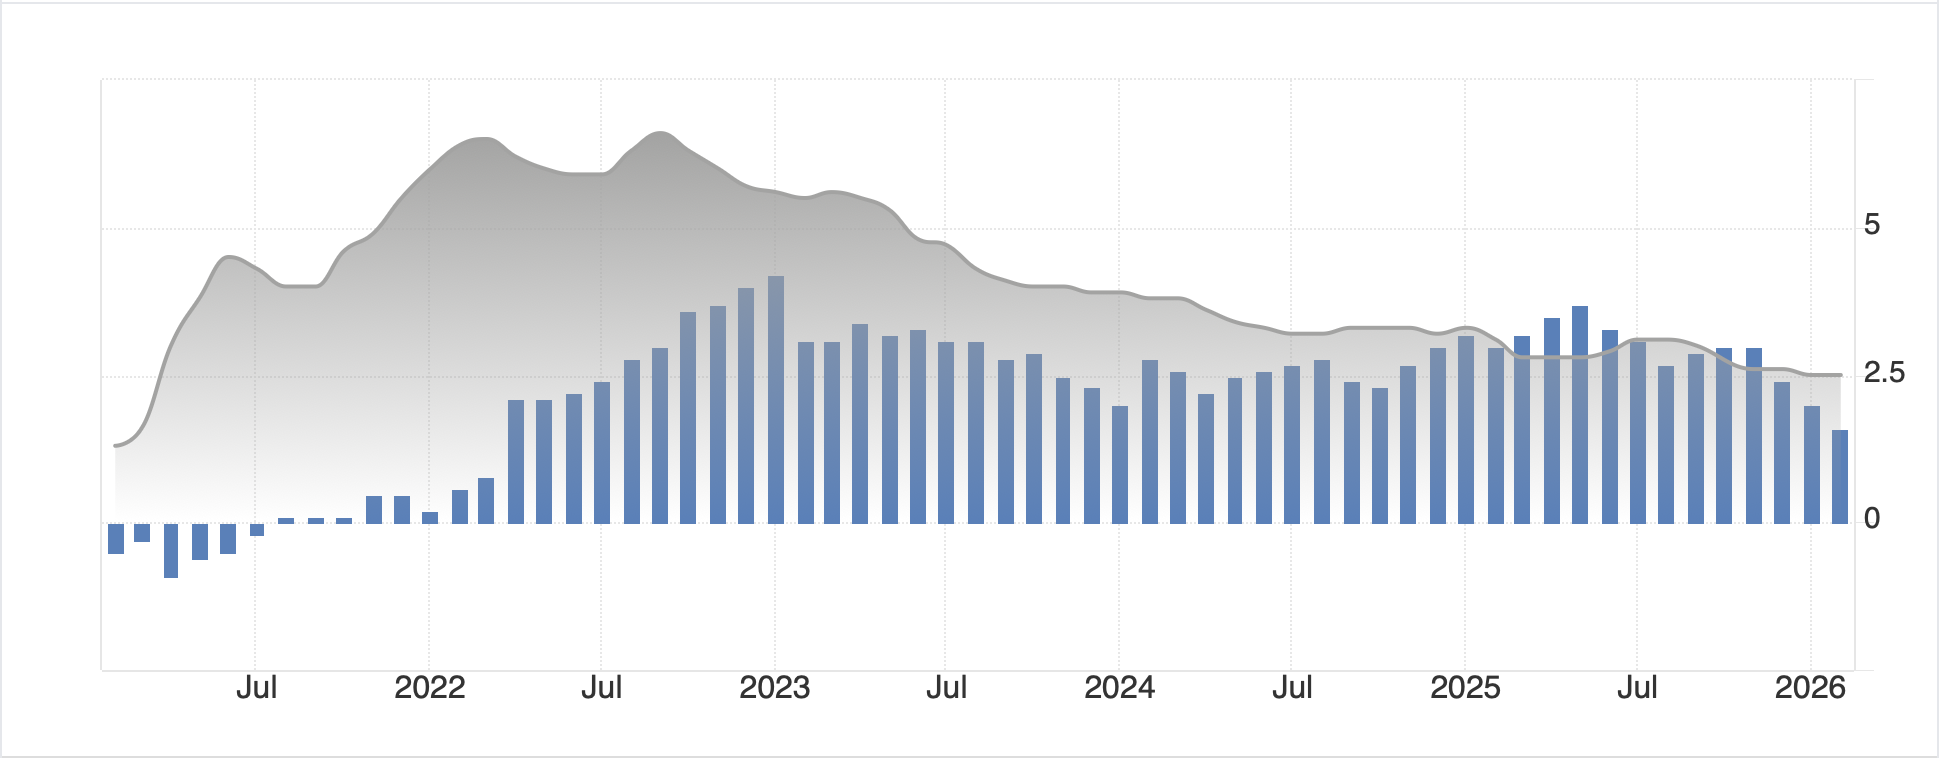
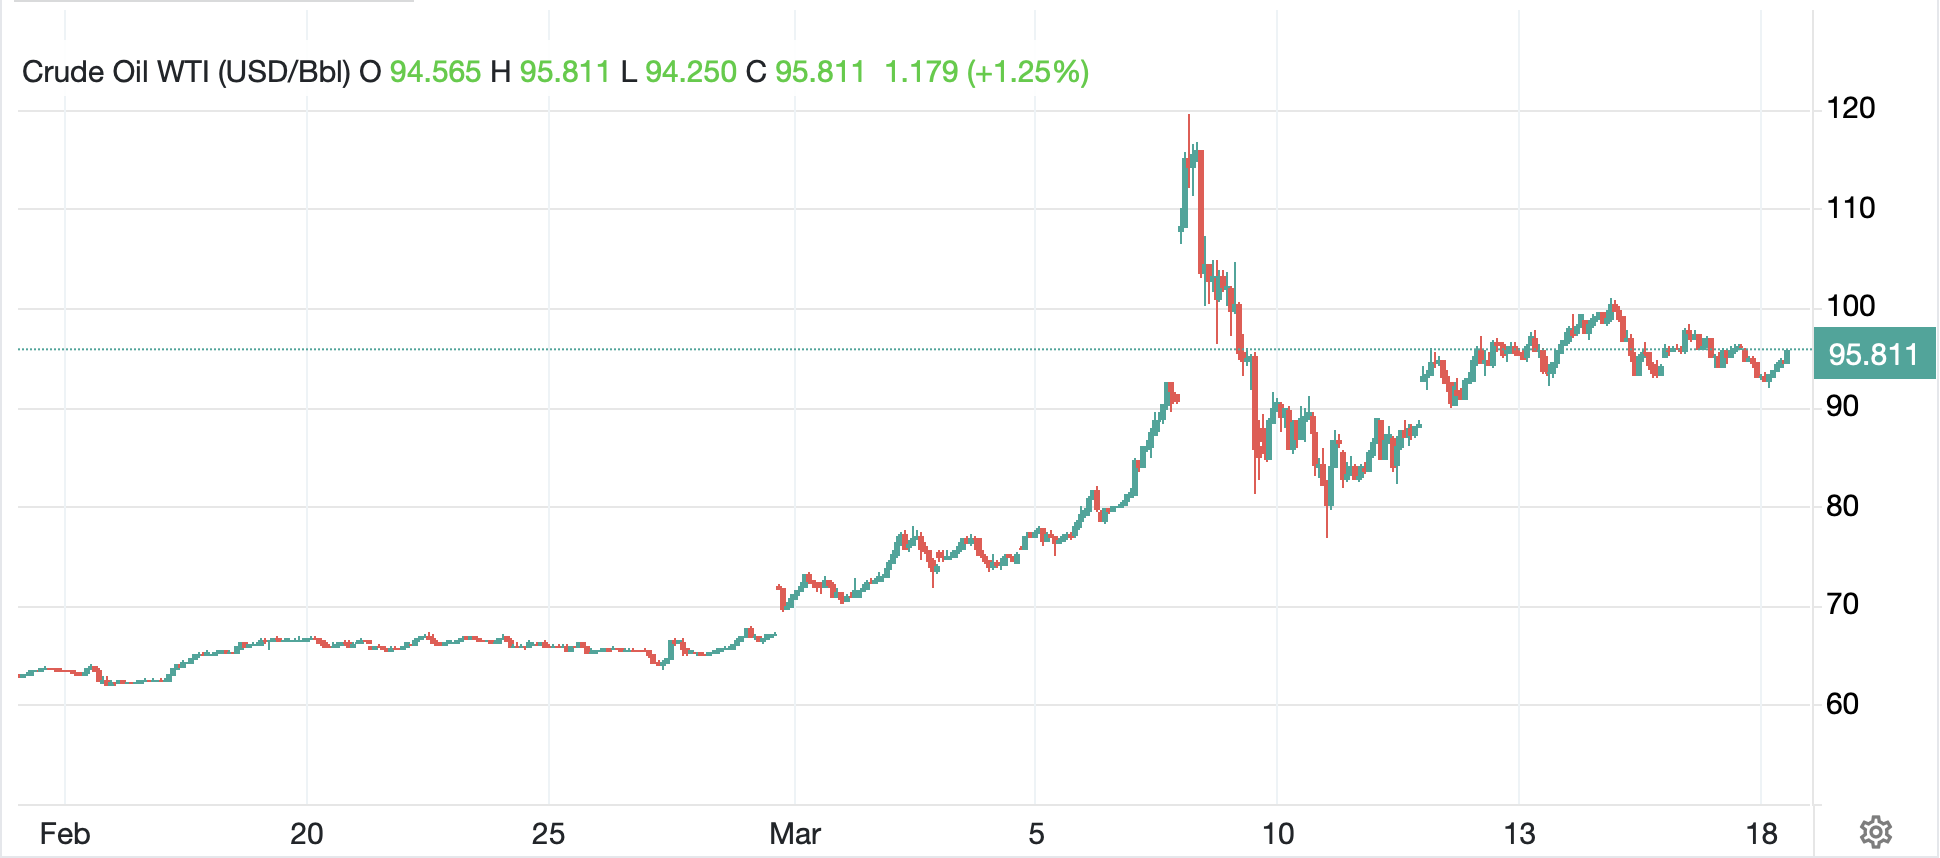
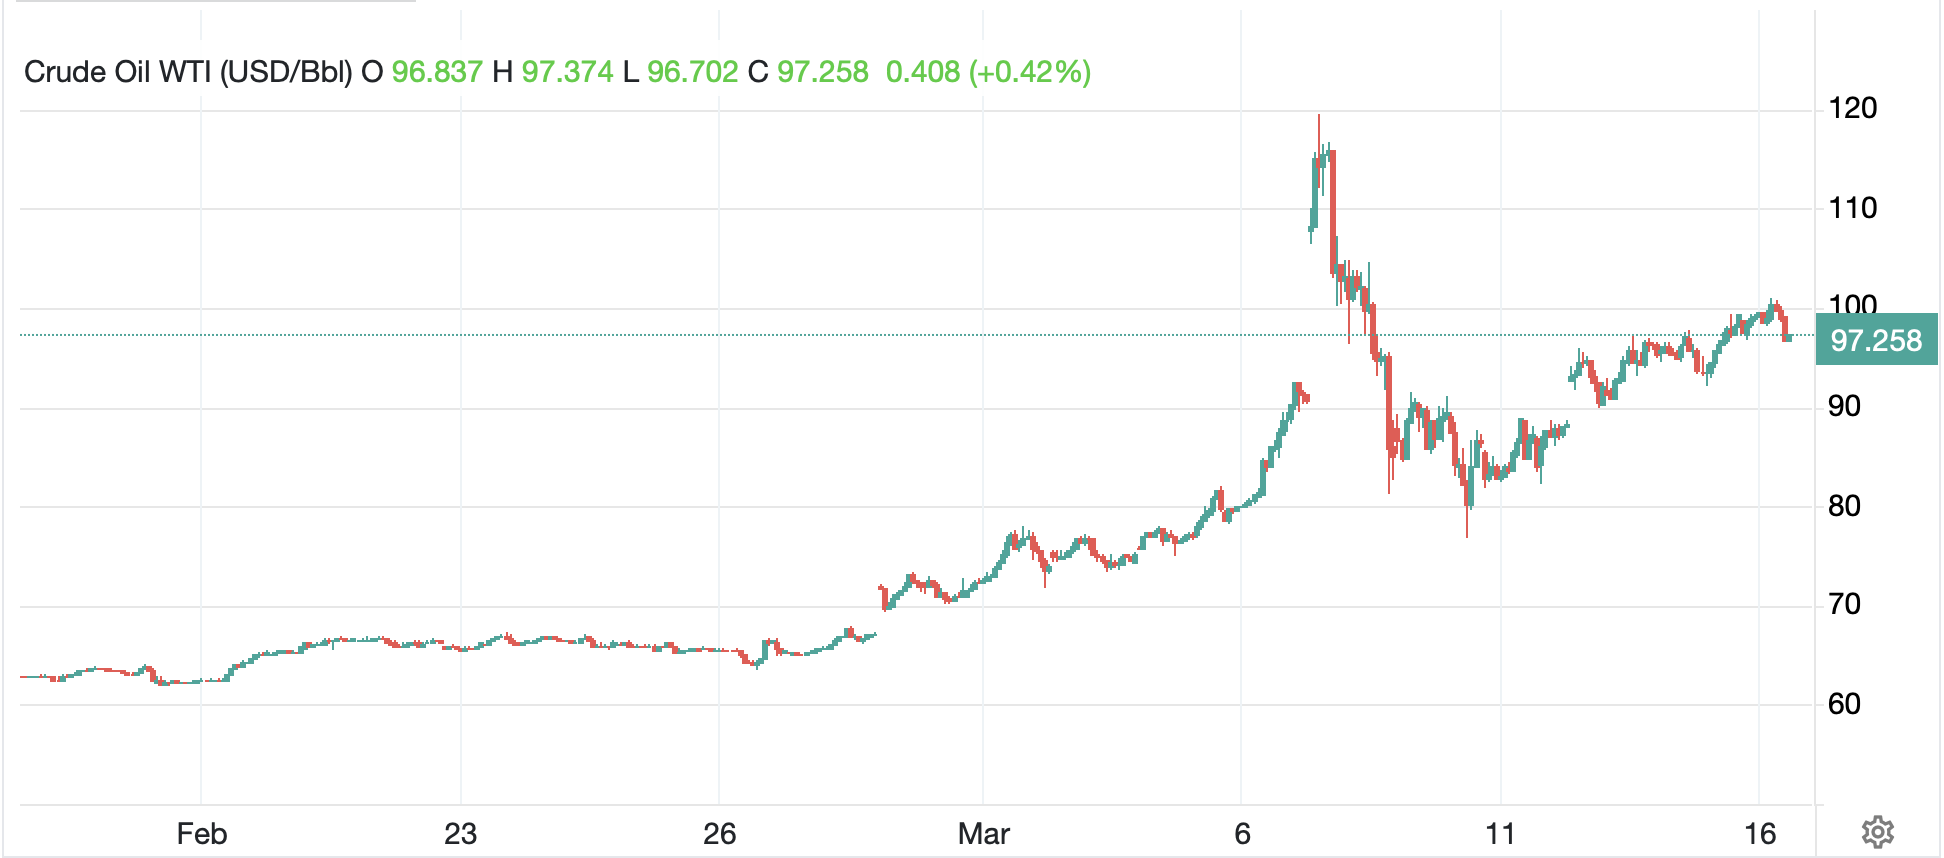
Turning to commodities, oil (+7.8%) has rebounded sharply as you can see in the below chart, actually trading now at its highest level since the initial spike move the evening the attacks began.
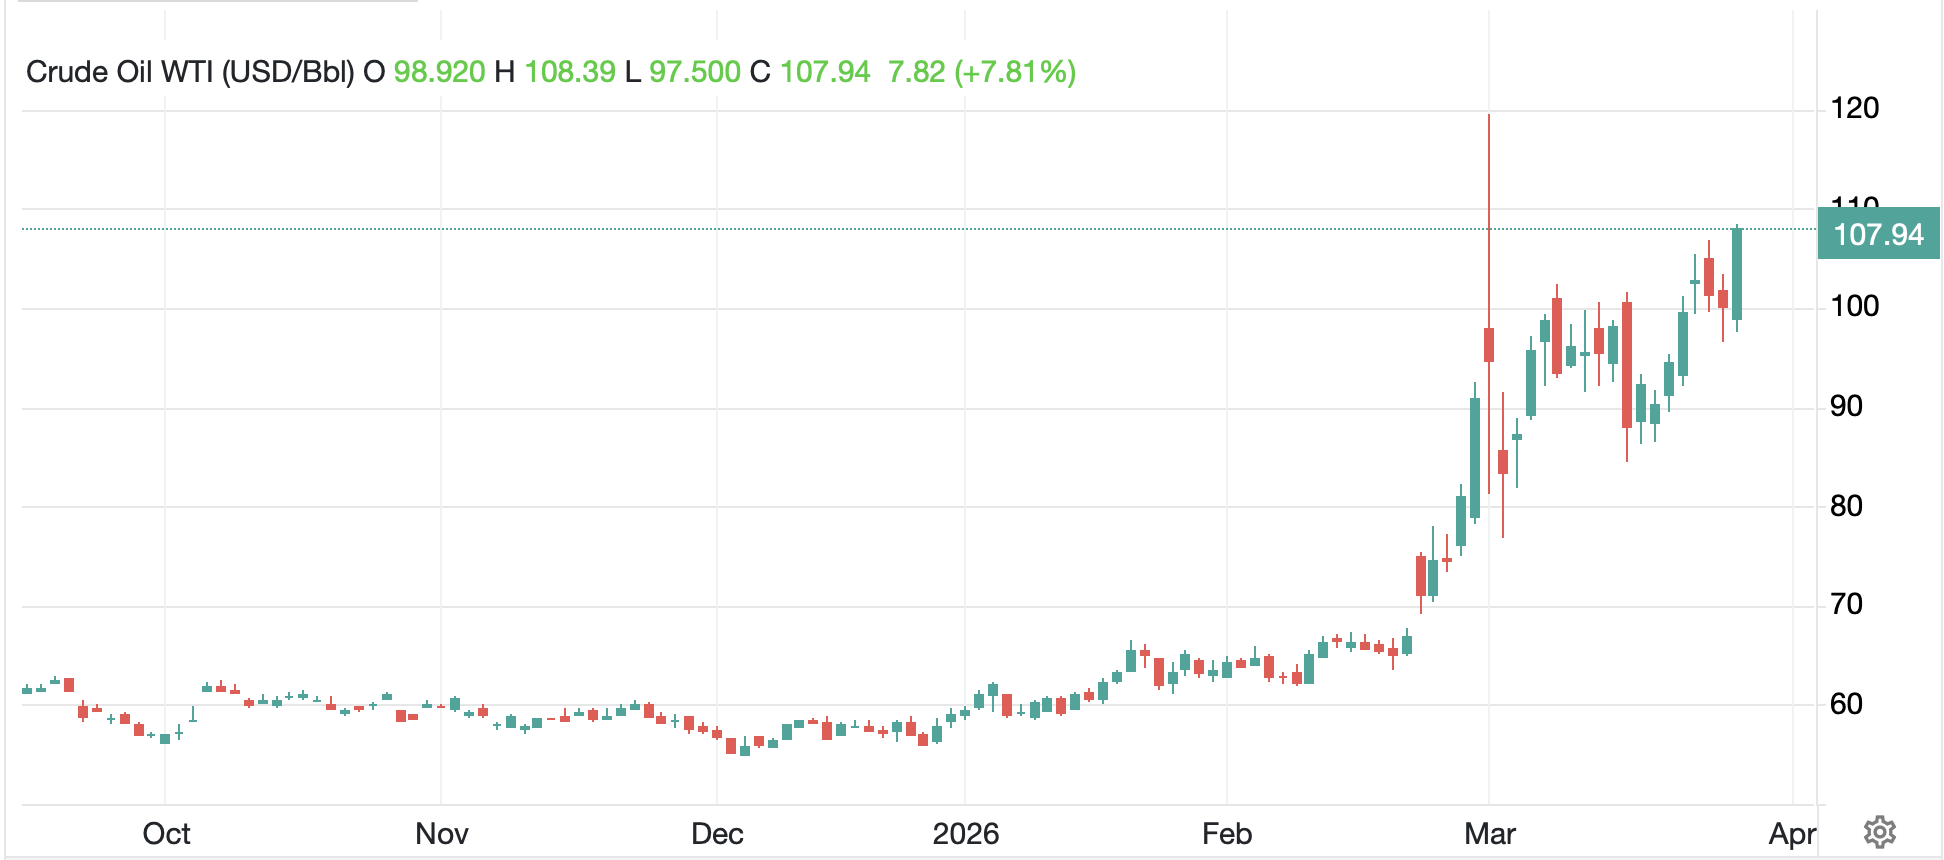
Source: tradingeconomics.com
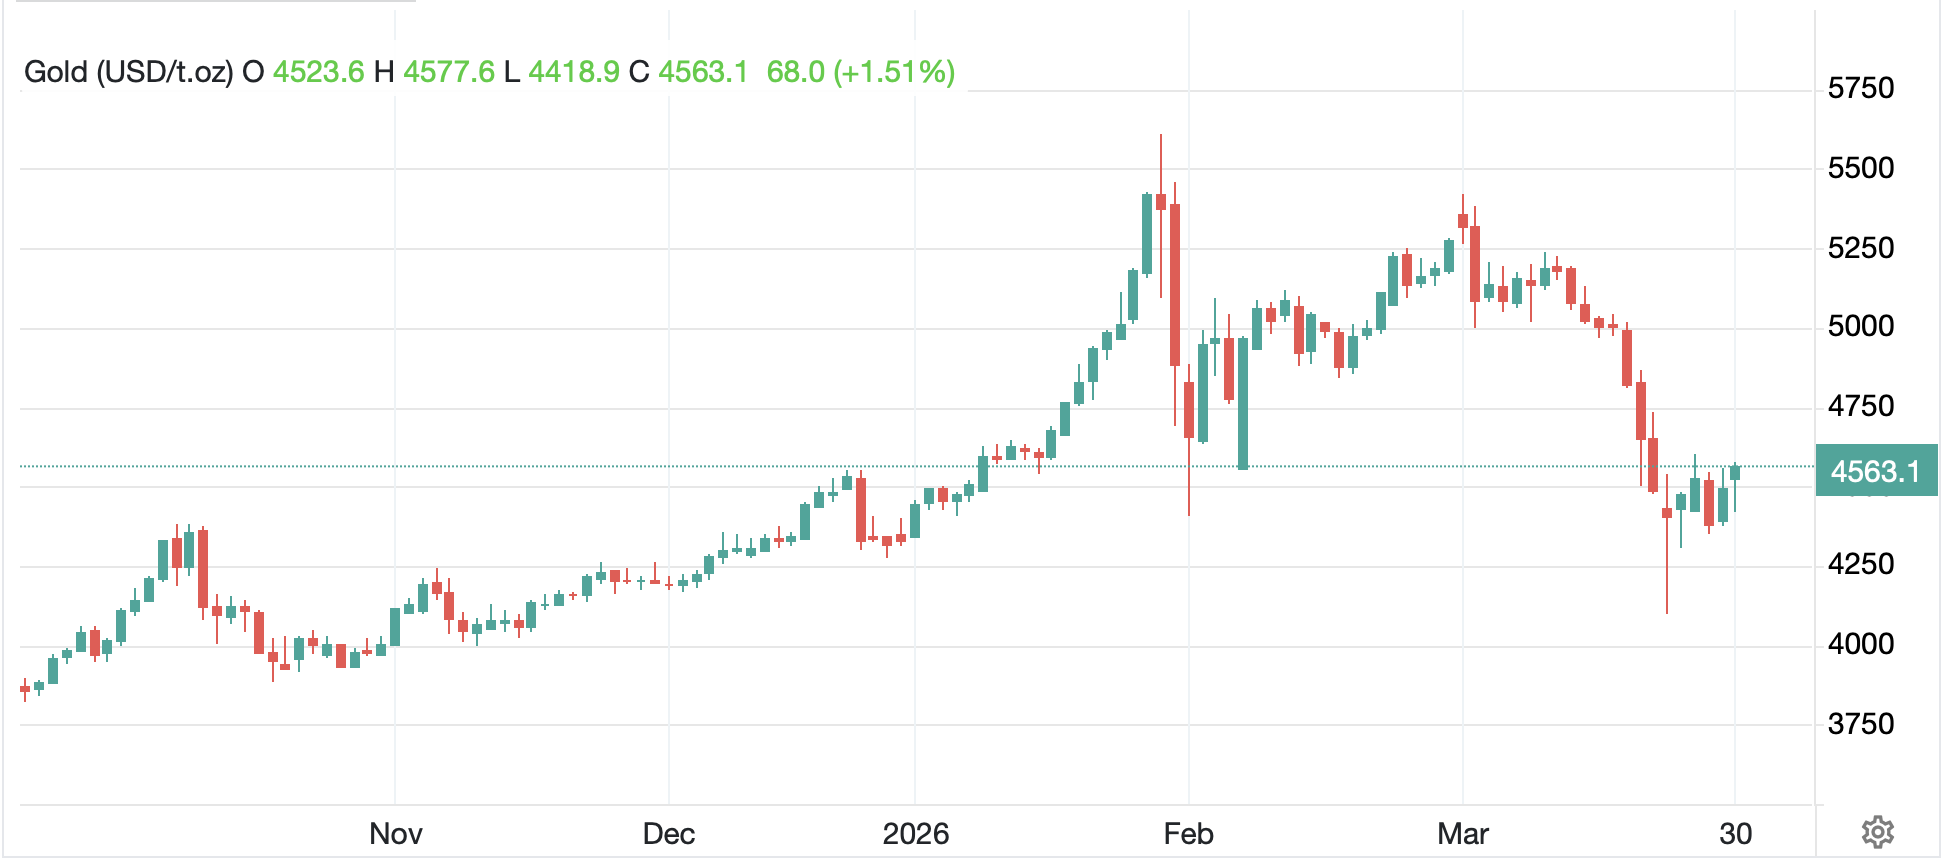
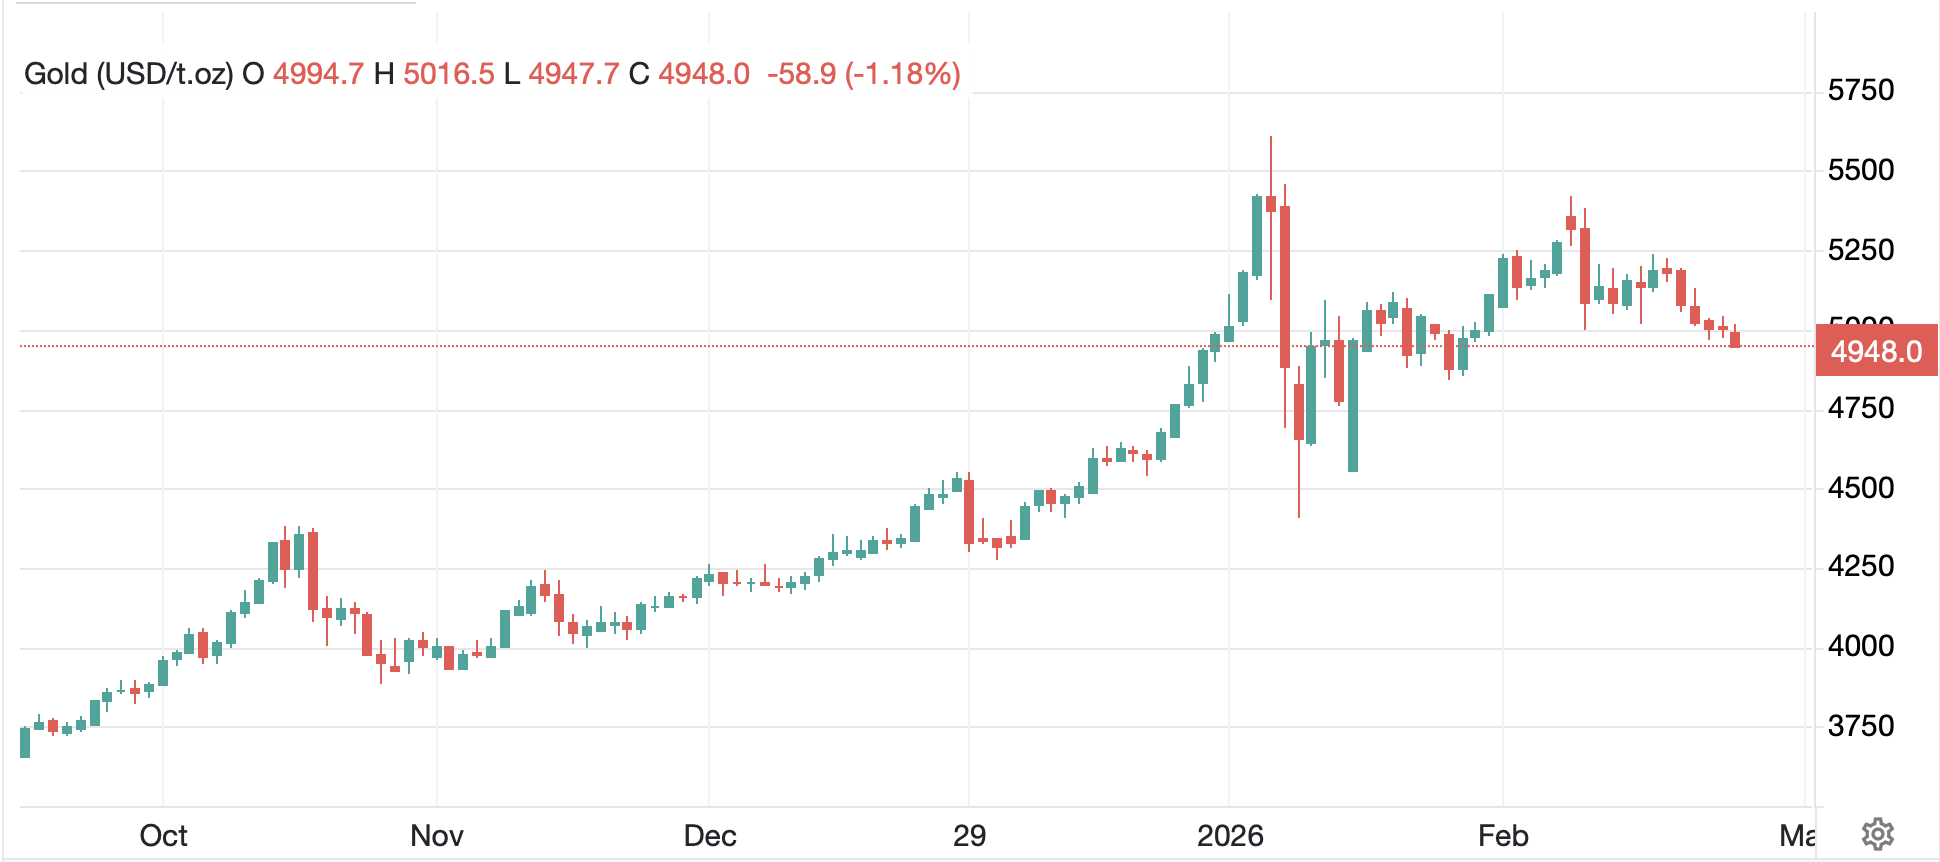
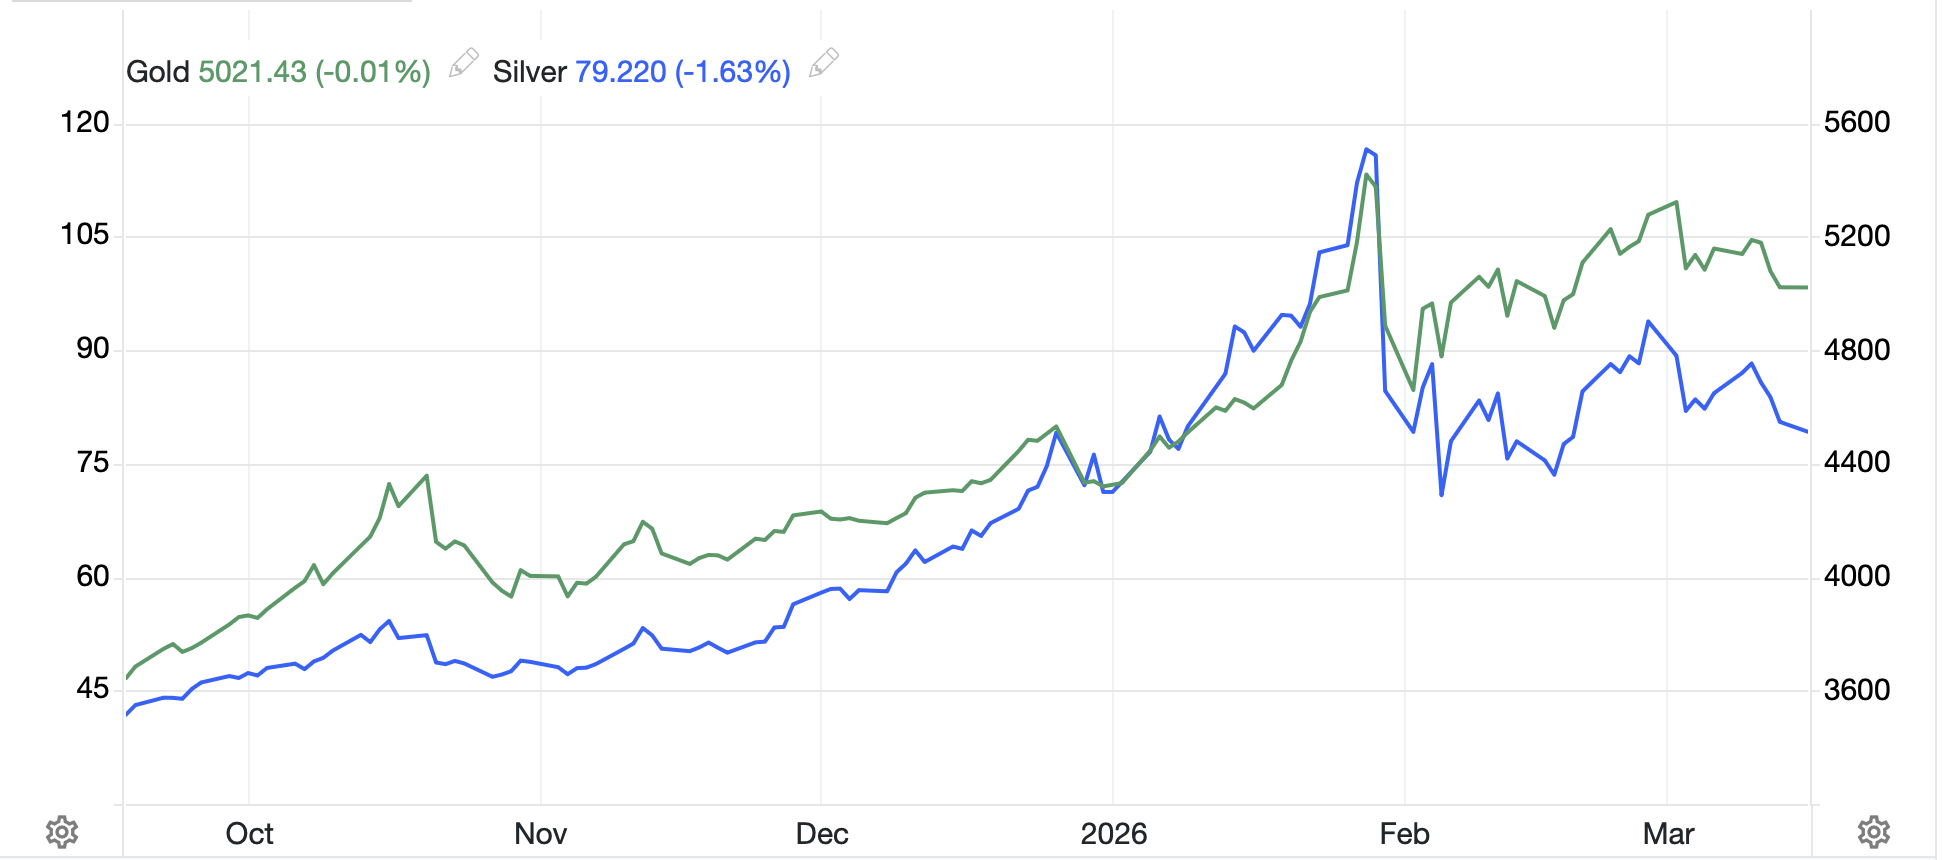
Brent crude rose a similar amount and interestingly, the spread between Brent and WTI has collapsed to just $0.52, it’s narrowest level since May 2022. That leads me to believe the market is pricing in a great deal more interest in US exports as oil supply will be curtailed for a while going forward. In keeping with the unwinding theme, precious metals were sold off aggressively with gold (-3.4%) and silver (-5.5%) retracing much of their recent gains. Both are still well above the spike lows seen two weeks ago, but I imagine that there is further to decline based on the current vibe.
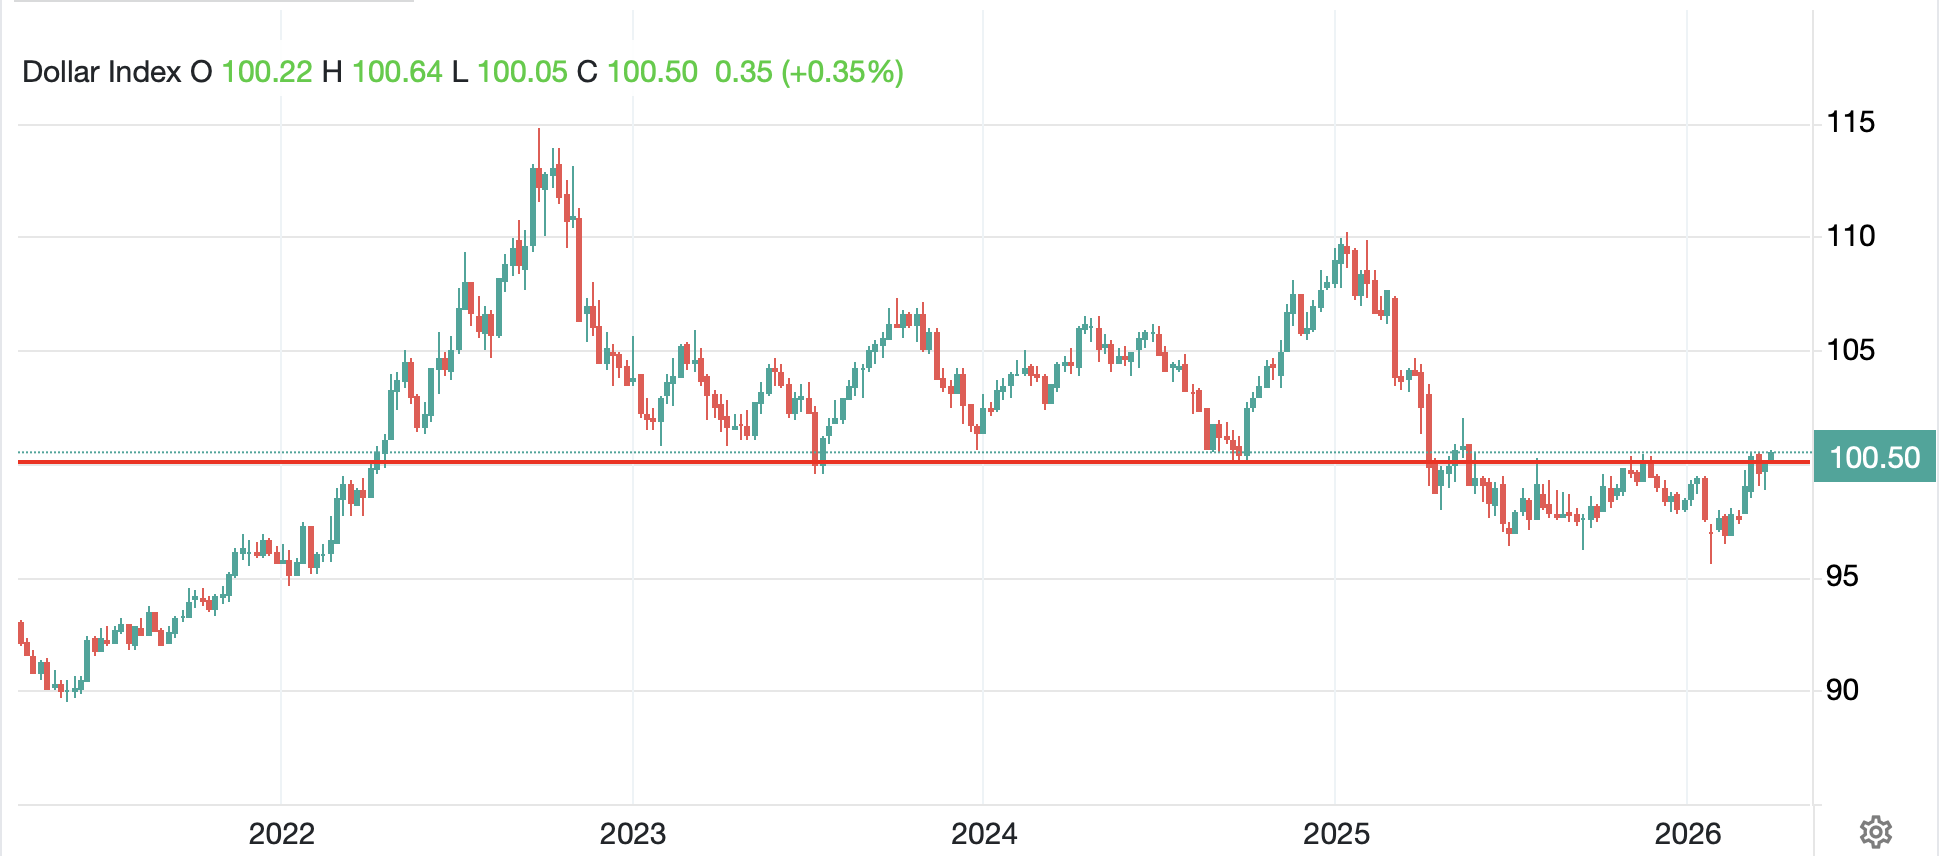
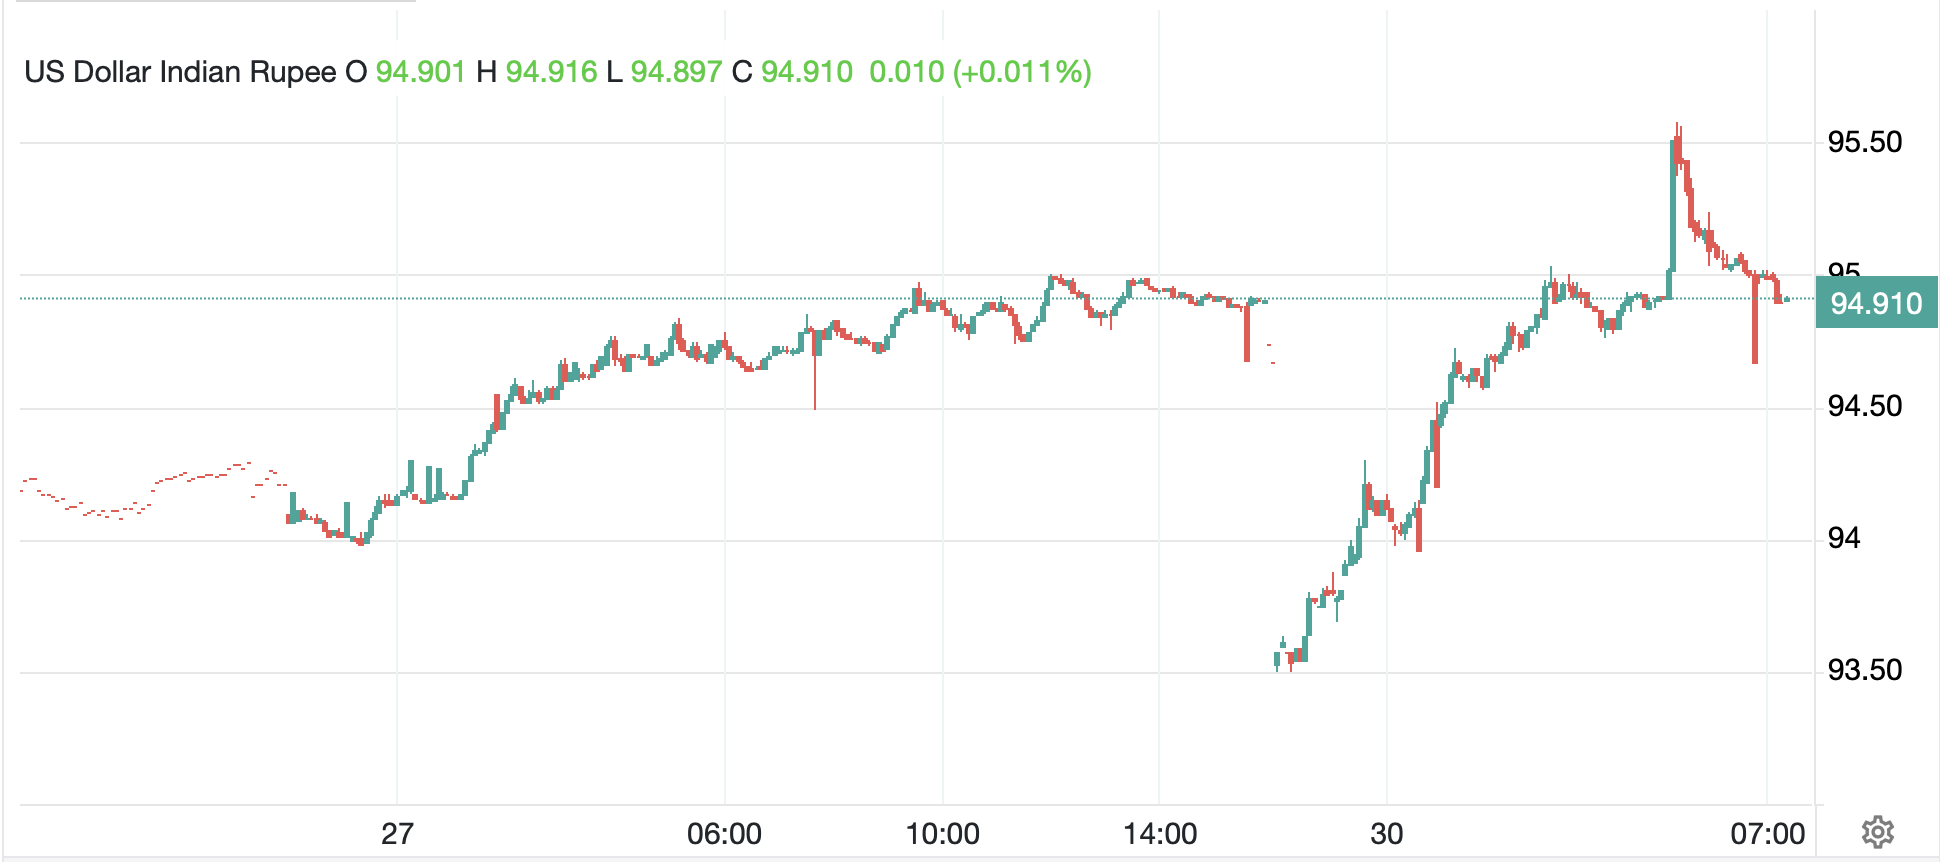
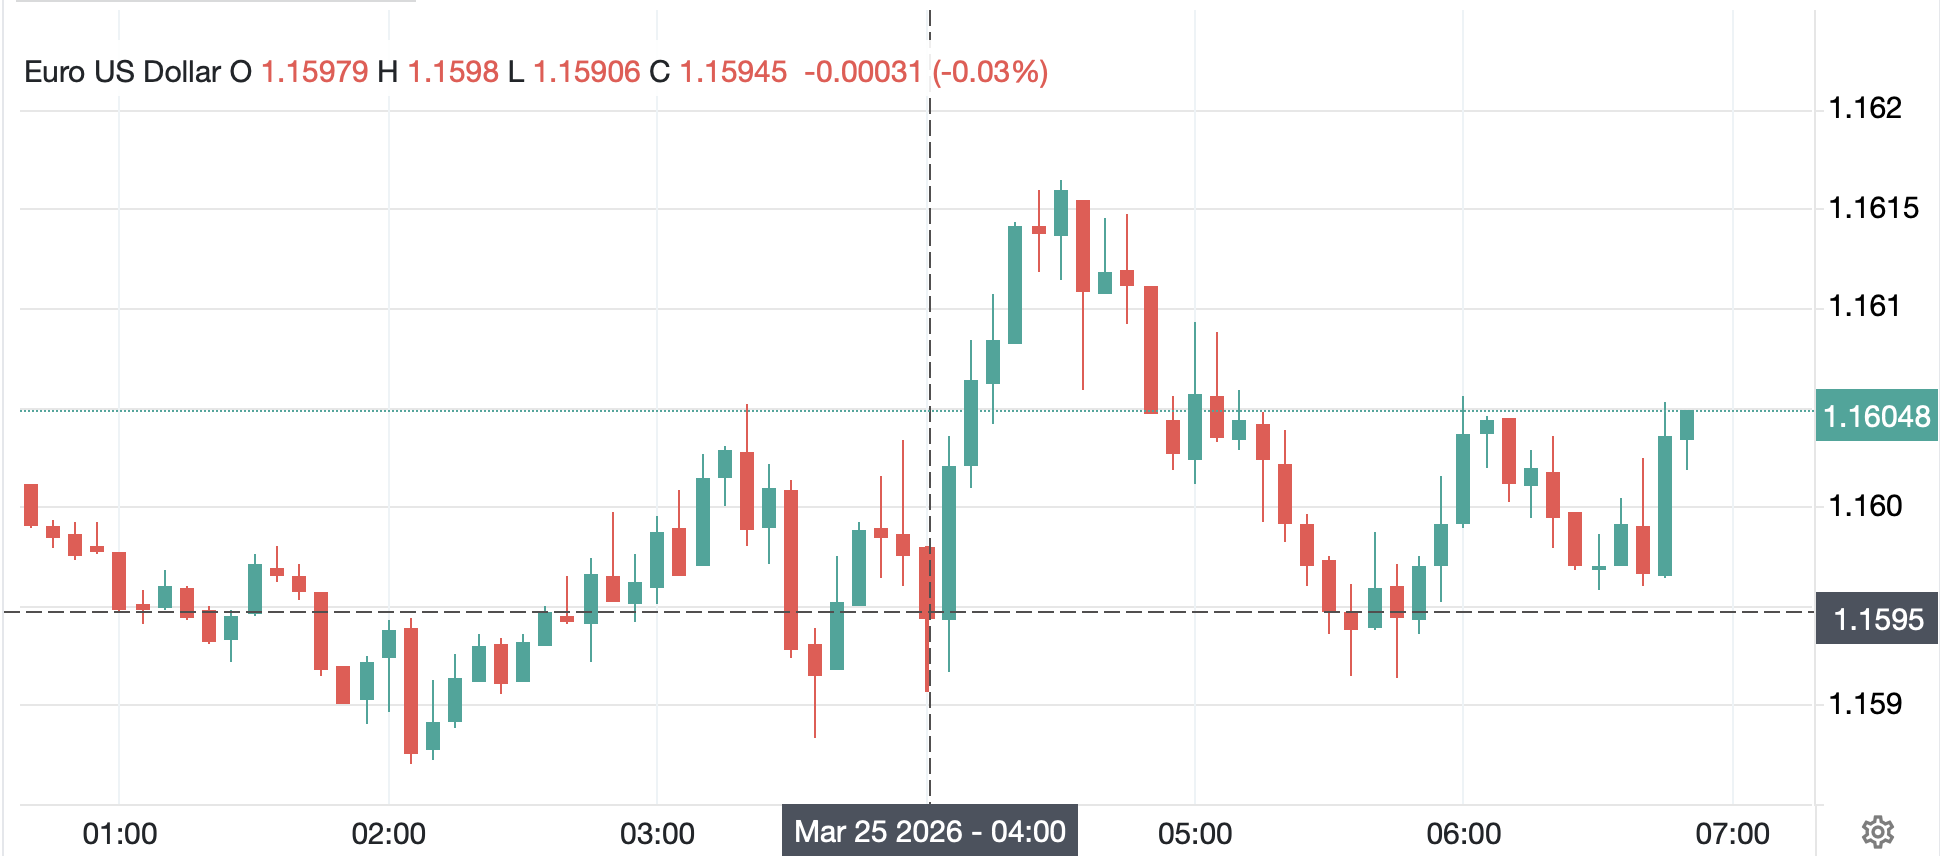
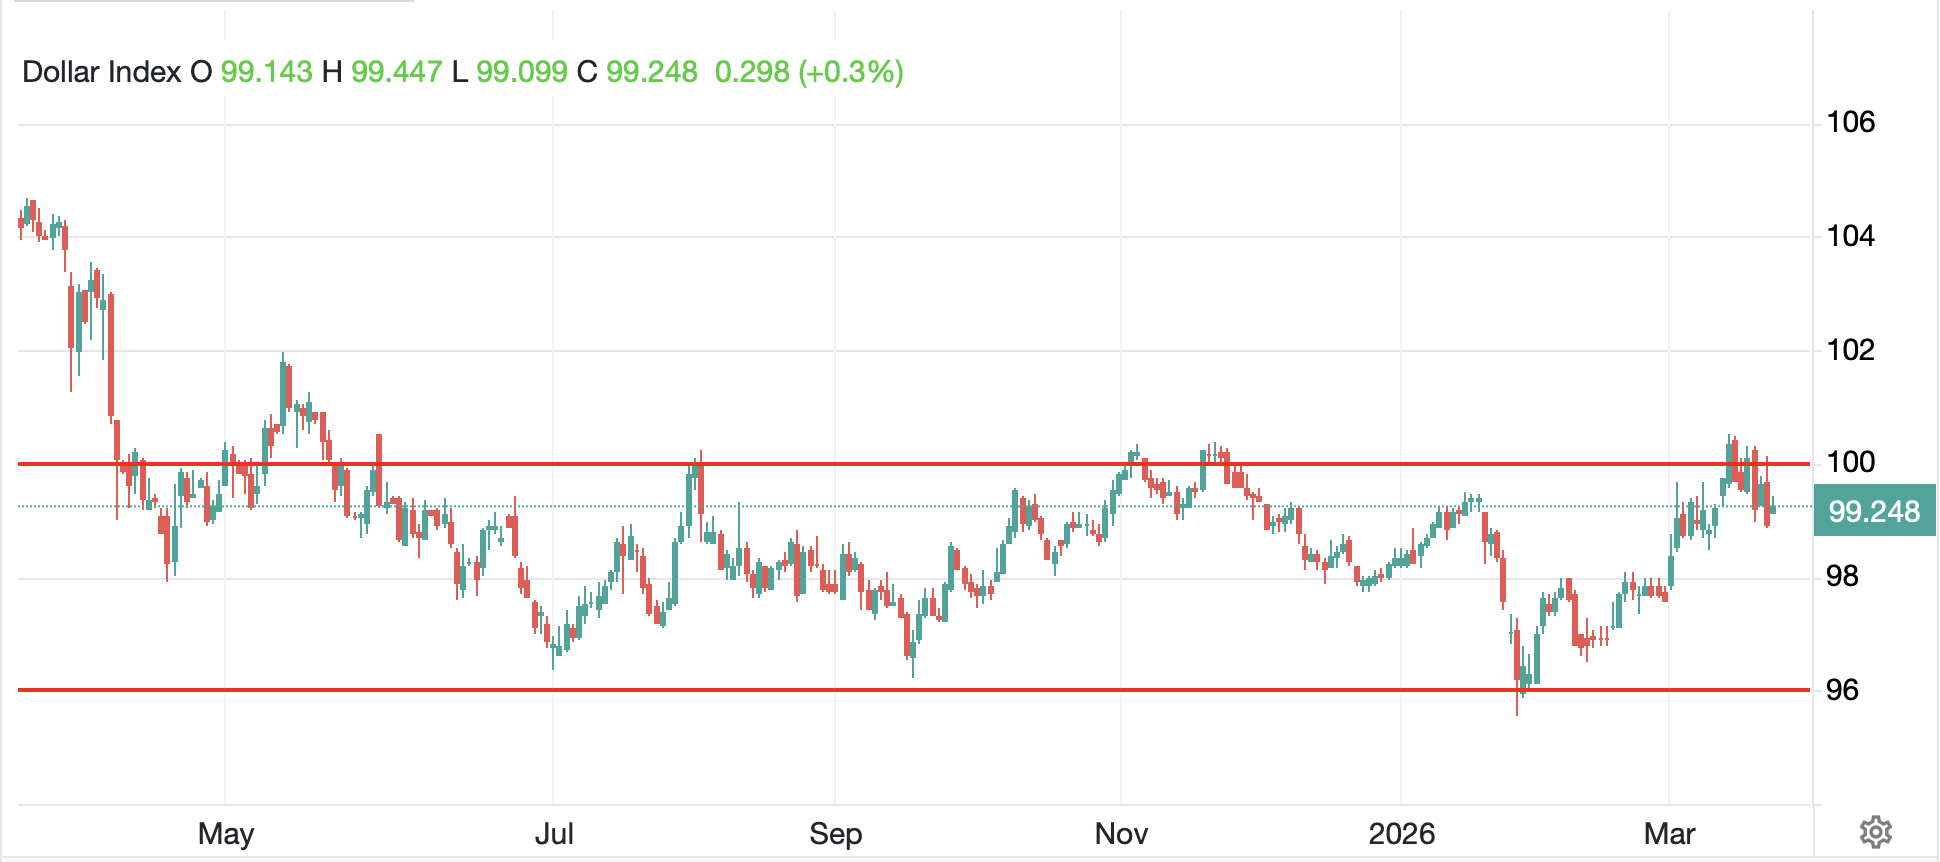
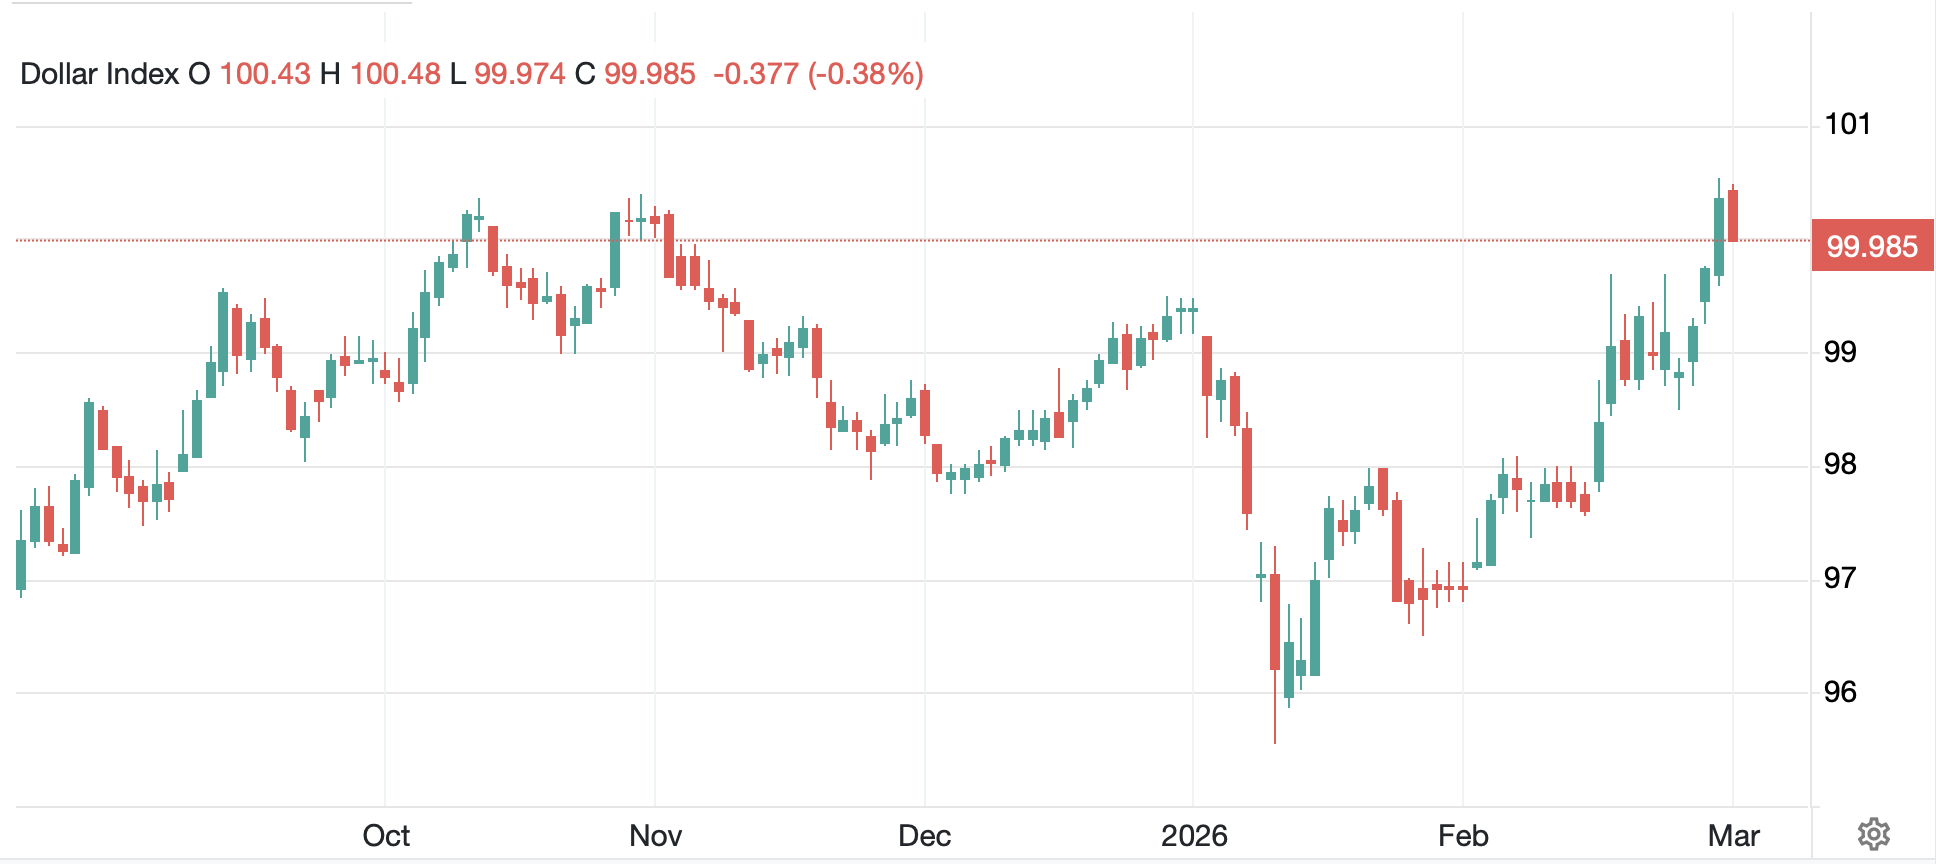
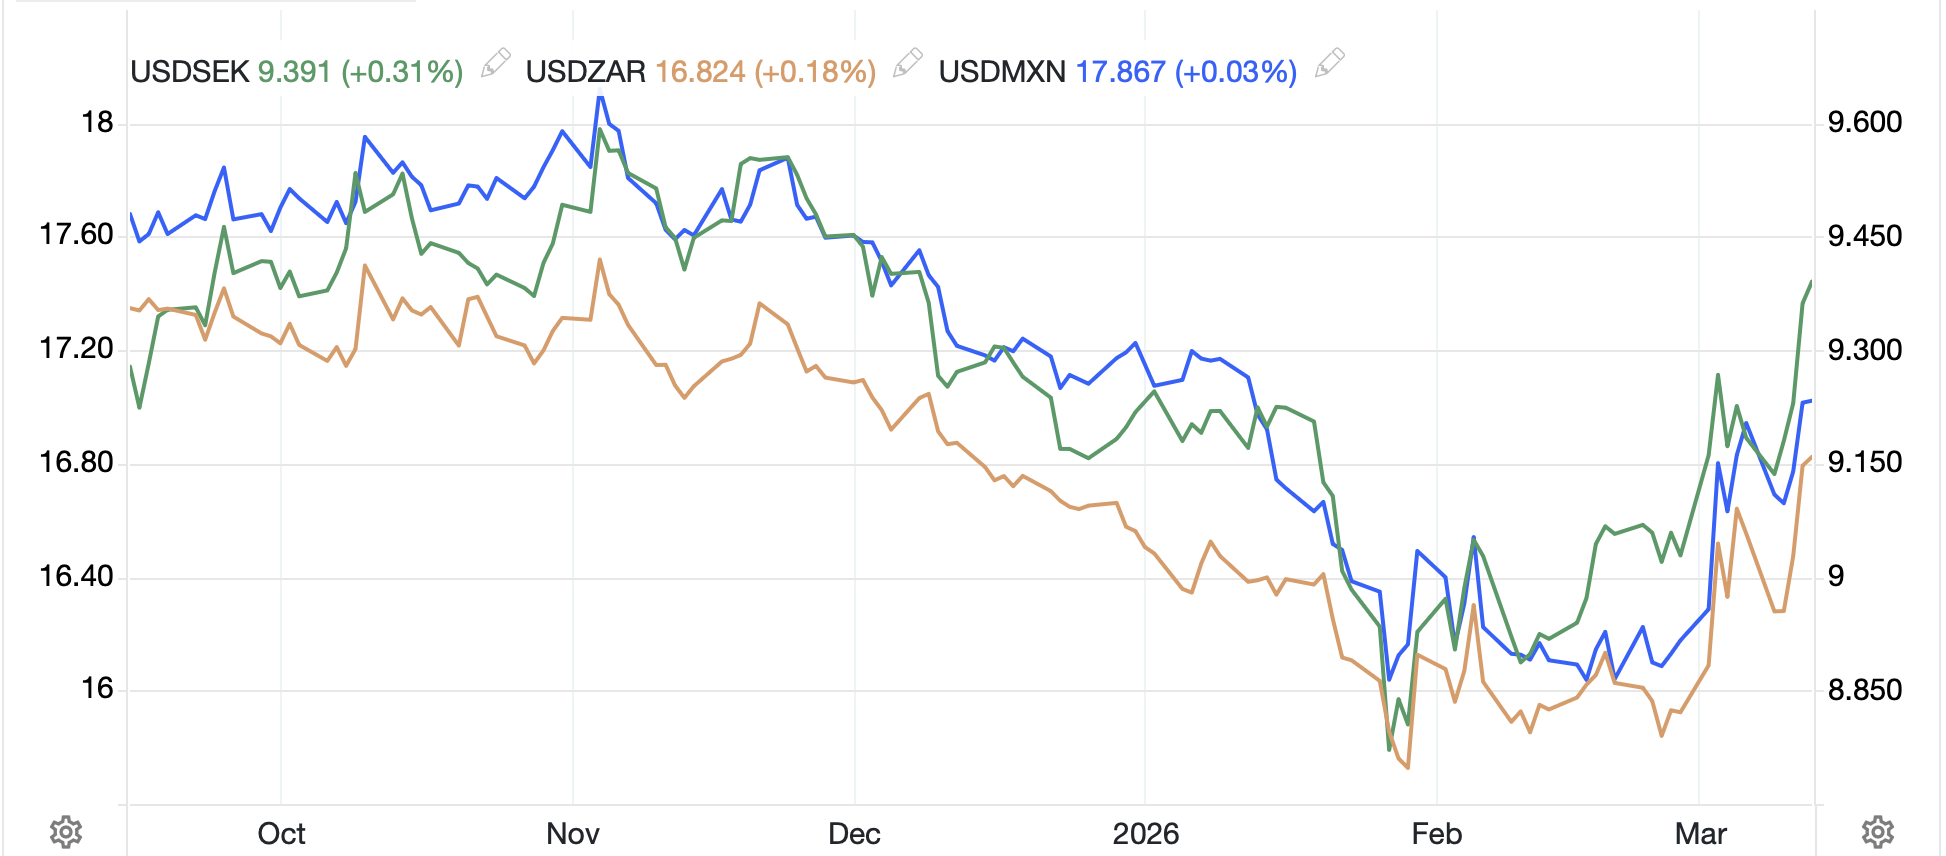
Finally, the dollar has rebounded sharply against all comers this morning with the DXY (+0.6%) back above the 100 level as the euro (-0.7%) probes 1.15 again and the yen (-0.5%) trades back toward 160.00. Nothing in the G10 has been spared, although CAD (-0.4%) and NOK (-0.4%) are the best performers as clearly oil’s rise is helping them both. In the EMG bloc, it should be no surprise that ZAR (-1.1%) is the laggard given the move in gold and platinum (-3.4%). But even CNY (-0.4%) has seen substantial selling while INR (-0.5%) and KRW (-0.2%) also continue to slide. The CE4 are all weaker by -0.7% and CLP (-0.9%) is feeling the weight of copper’s decline. The only outlier really, today, is Brazil (0.0%) which is unchanged as remember, they are a major oil producer and far away from the current problems.
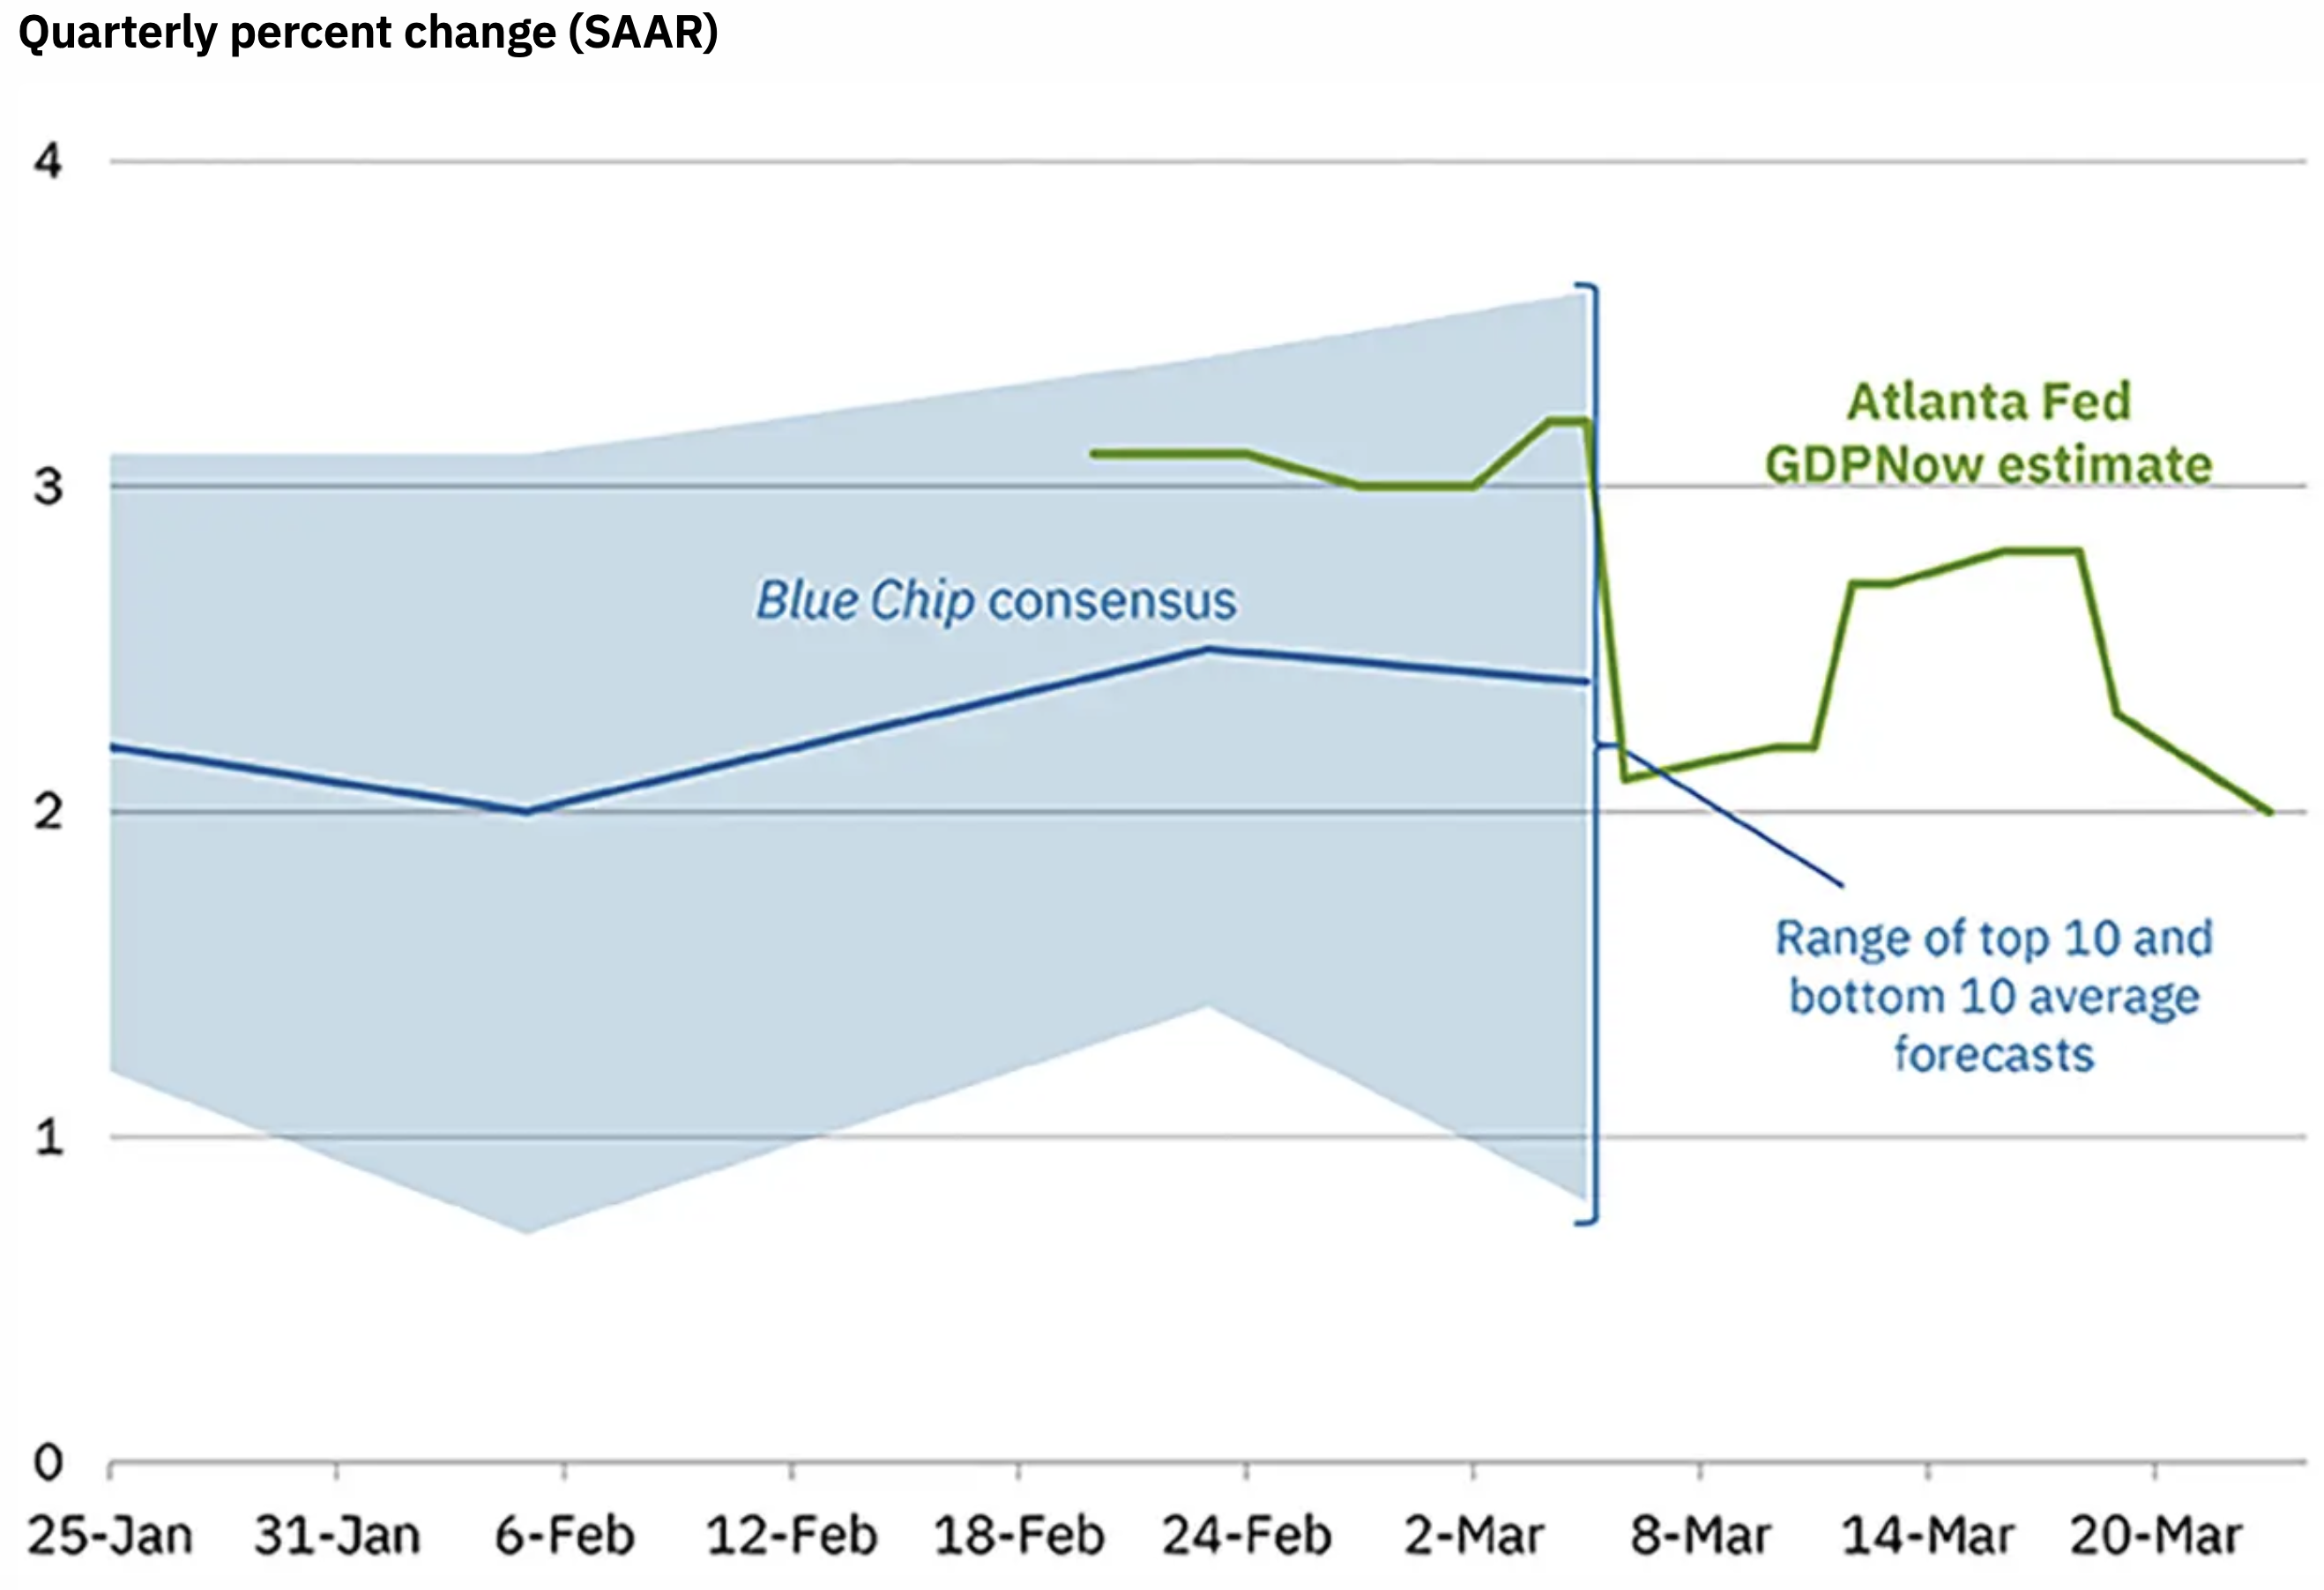
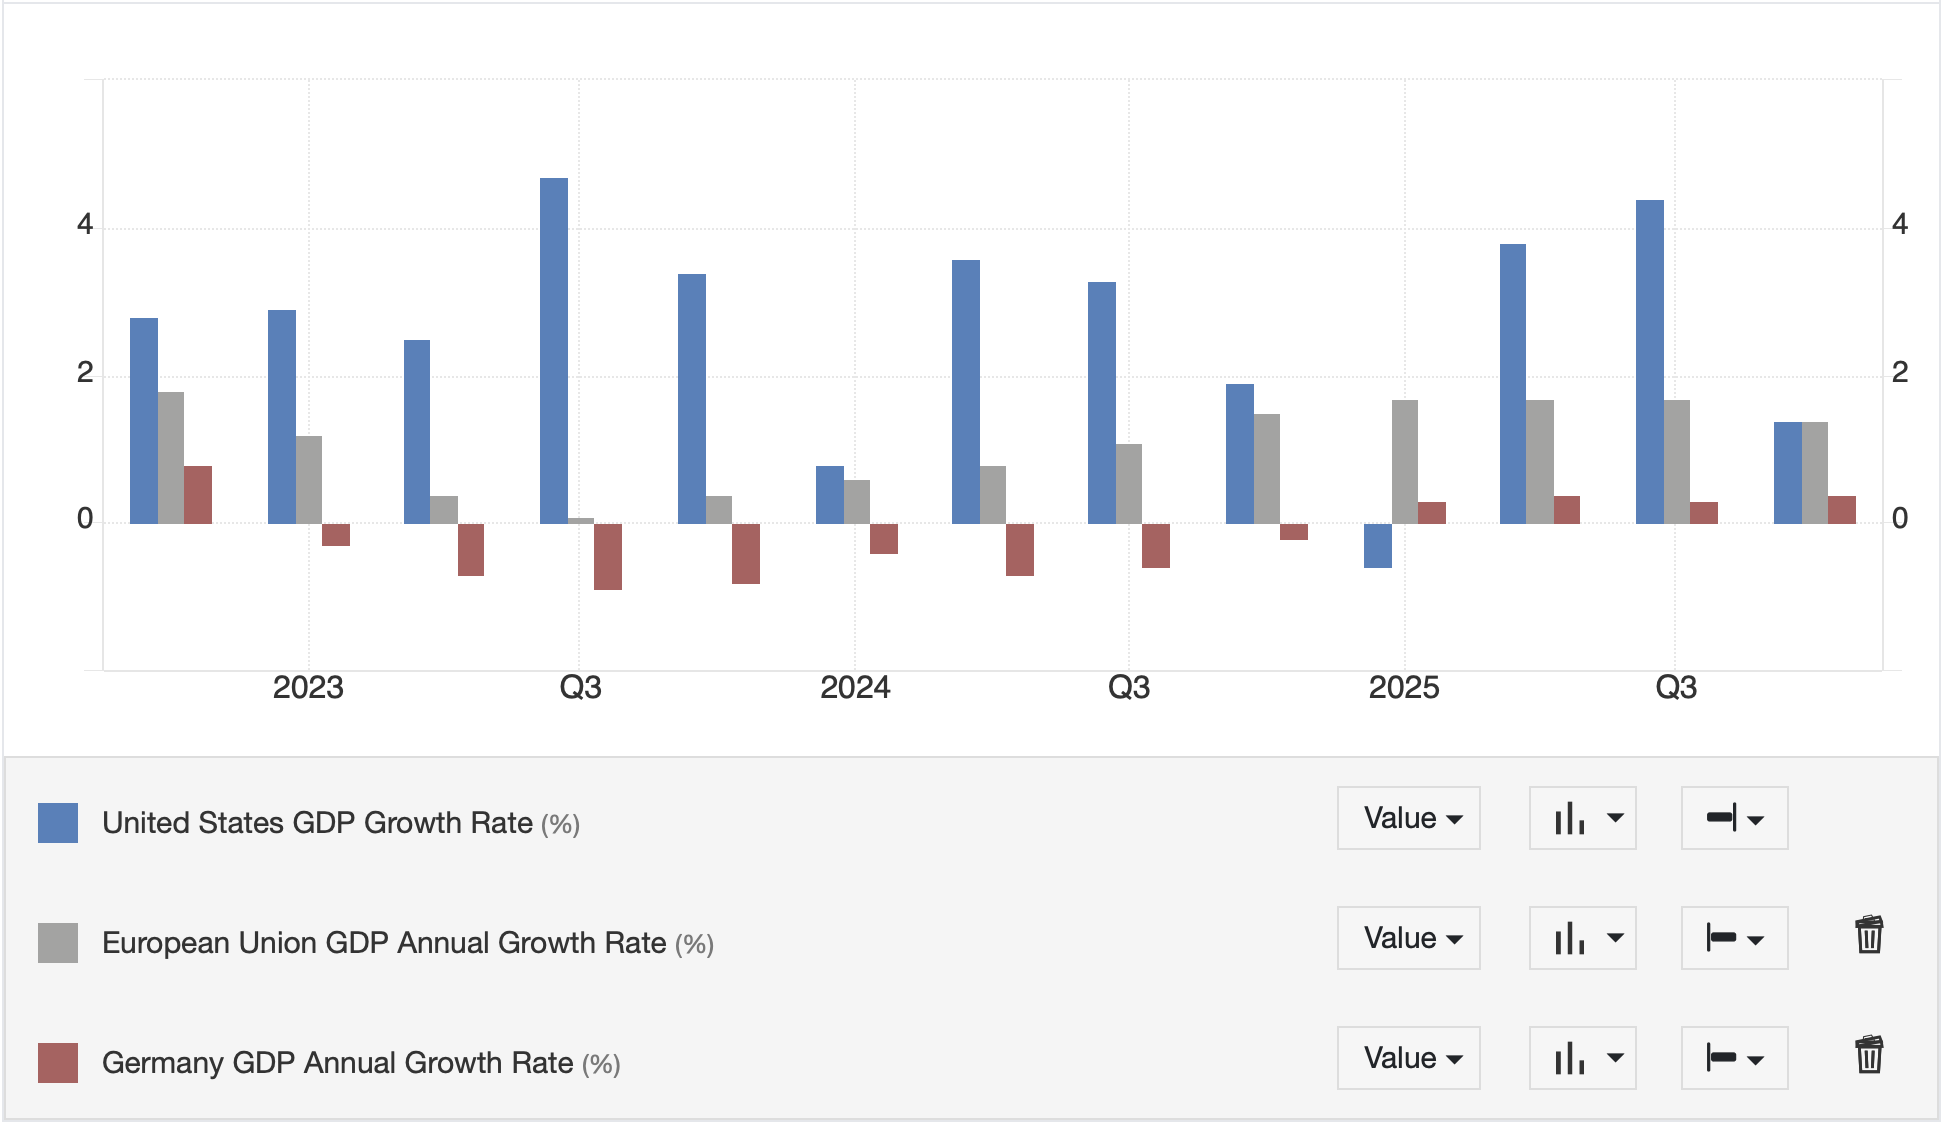
On the data front, this morning brings Initial (exp 212K) and Continuing (1840K) Claims as well as the Trade Balance (-$59.2B), none of which seem likely to matter to markets. Yesterday saw generally stronger than expected data with ISM Manufacturing ticking up to 52.7 while Retail Sales surprised a tick higher as well at 0.6%, 0.5% ex autos. ADP Employment was also modestly better than expected. As such, it continues to be difficult to call for a significantly weaker US economy, at least based on the data we continue to see. However, the Atlanta Fed’s GDPNow reading was revised to 1.9% for Q1 yesterday, down a tick from the previous estimate. Still, that is not a collapse.
Pulling it all together, the war in Iran is going to continue for at least 2-3 more weeks and there is no clarity on whether the US is going to attempt to take Kharg Island. It still seems to be part of the discussion, but as I wrote yesterday, strategic ambiguity is a key part of President Trump’s method. In the meantime, my take is we are much more likely to behave like the end of last week going forward, than the beginning of this week. That means risk will be reduced and the dollar will benefit.
Good luck
Adf