The war has now widened in scope
And though all of us truly hope
It won’t last too long
We could, there, be wrong
As such we must all learn to cope
So, oil, right now, knows no top
While havens like bonds are a flop
There’s no place to hide
Thus, you must decide
If trading makes sense or should stop
Carl von Clausewitz, the 19th century Prussian military strategist, is credited with describing the fog of war in his 1832 book, On War. “…three quarters of the factors on which action in war is based are wrapped in a fog of greater or lesser uncertainty.” This is quite an apt description of things, even now with cameras literally everywhere in the world. Context remains difficult to understand, and, of course, there is an enormous amount of propaganda from both sides of any conflict as the protagonists attempt to sway both their own populations and those of their opponents.
I highlight this because I continue to be amazed at the certitude with which some analysts proclaim to “know” how things will turn out. As I have written elsewhere, nobody knows nuthin right now. With that in mind, I would highlight the IMF’s statement yesterday which added exactly zero to the conversation, “It is too early to assess the economic impact on the region and the global economy. That impact will depend on the extent and duration of the conflict.” Now, don’t you feel educated after that pronouncement?
At any rate, with more than a full day’s trading in financial markets, perhaps we can try to assess how things are going. The first thing to note is that many alleged haven assets are not performing up to snuff, notably Treasury bonds, Japanese yen, Swiss francs and gold. In fact, as of this morning, the only traditional haven that is performing as expected is the dollar.
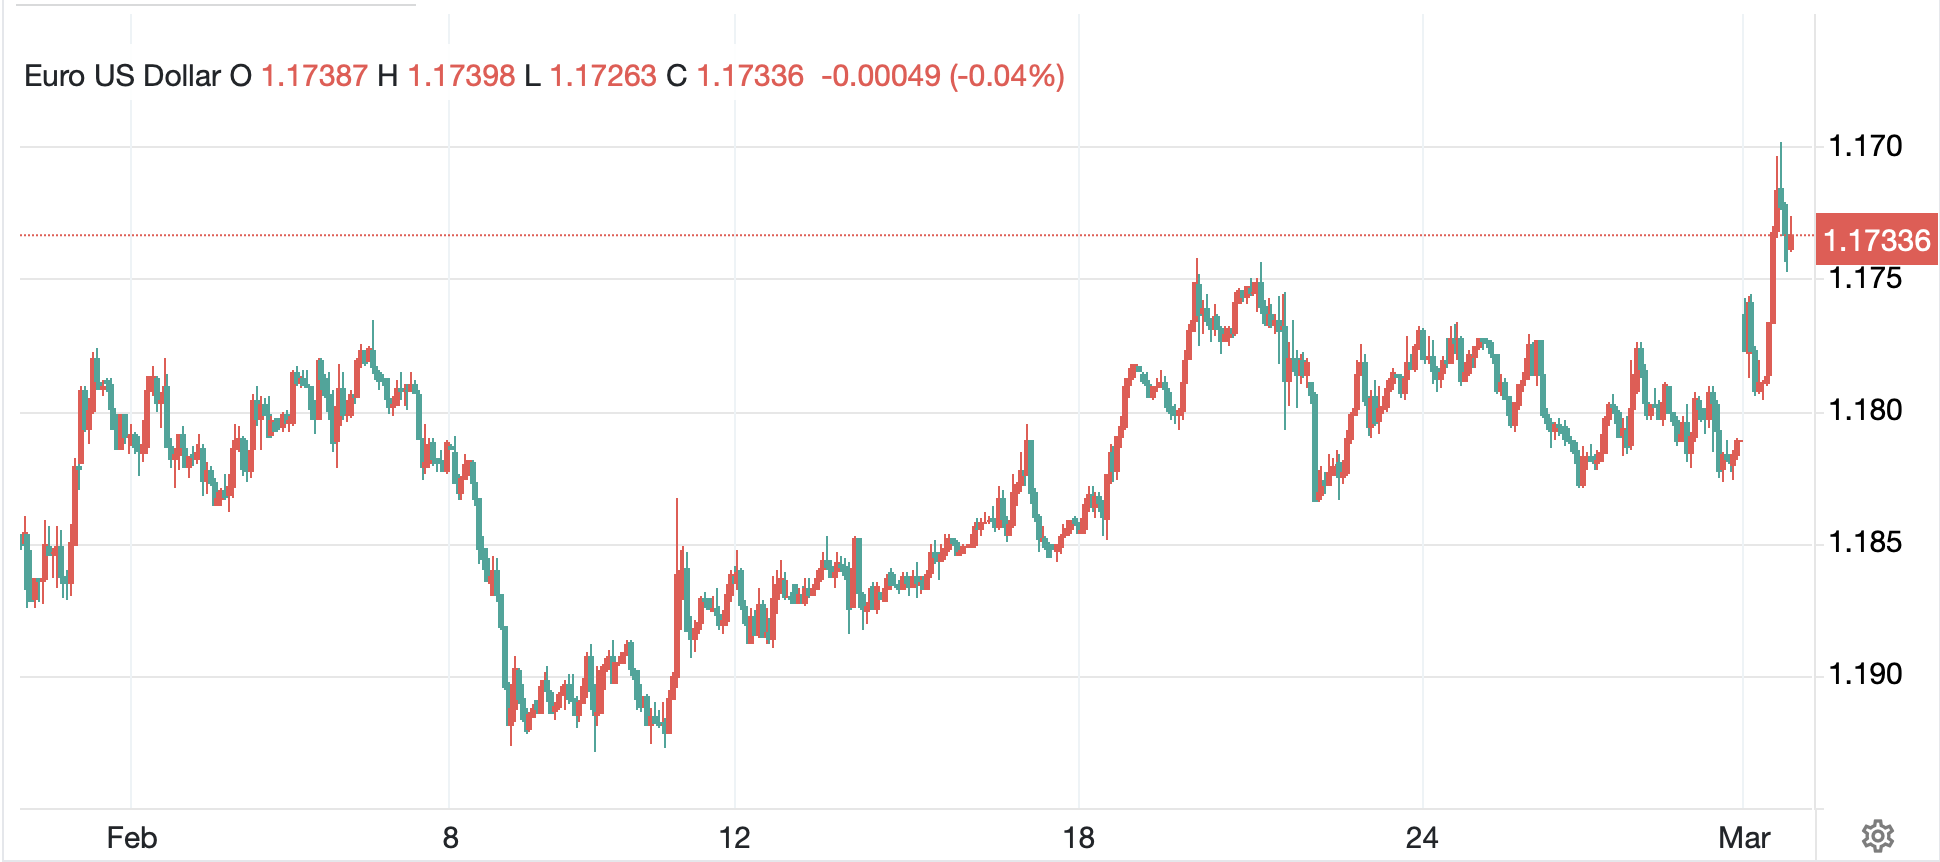
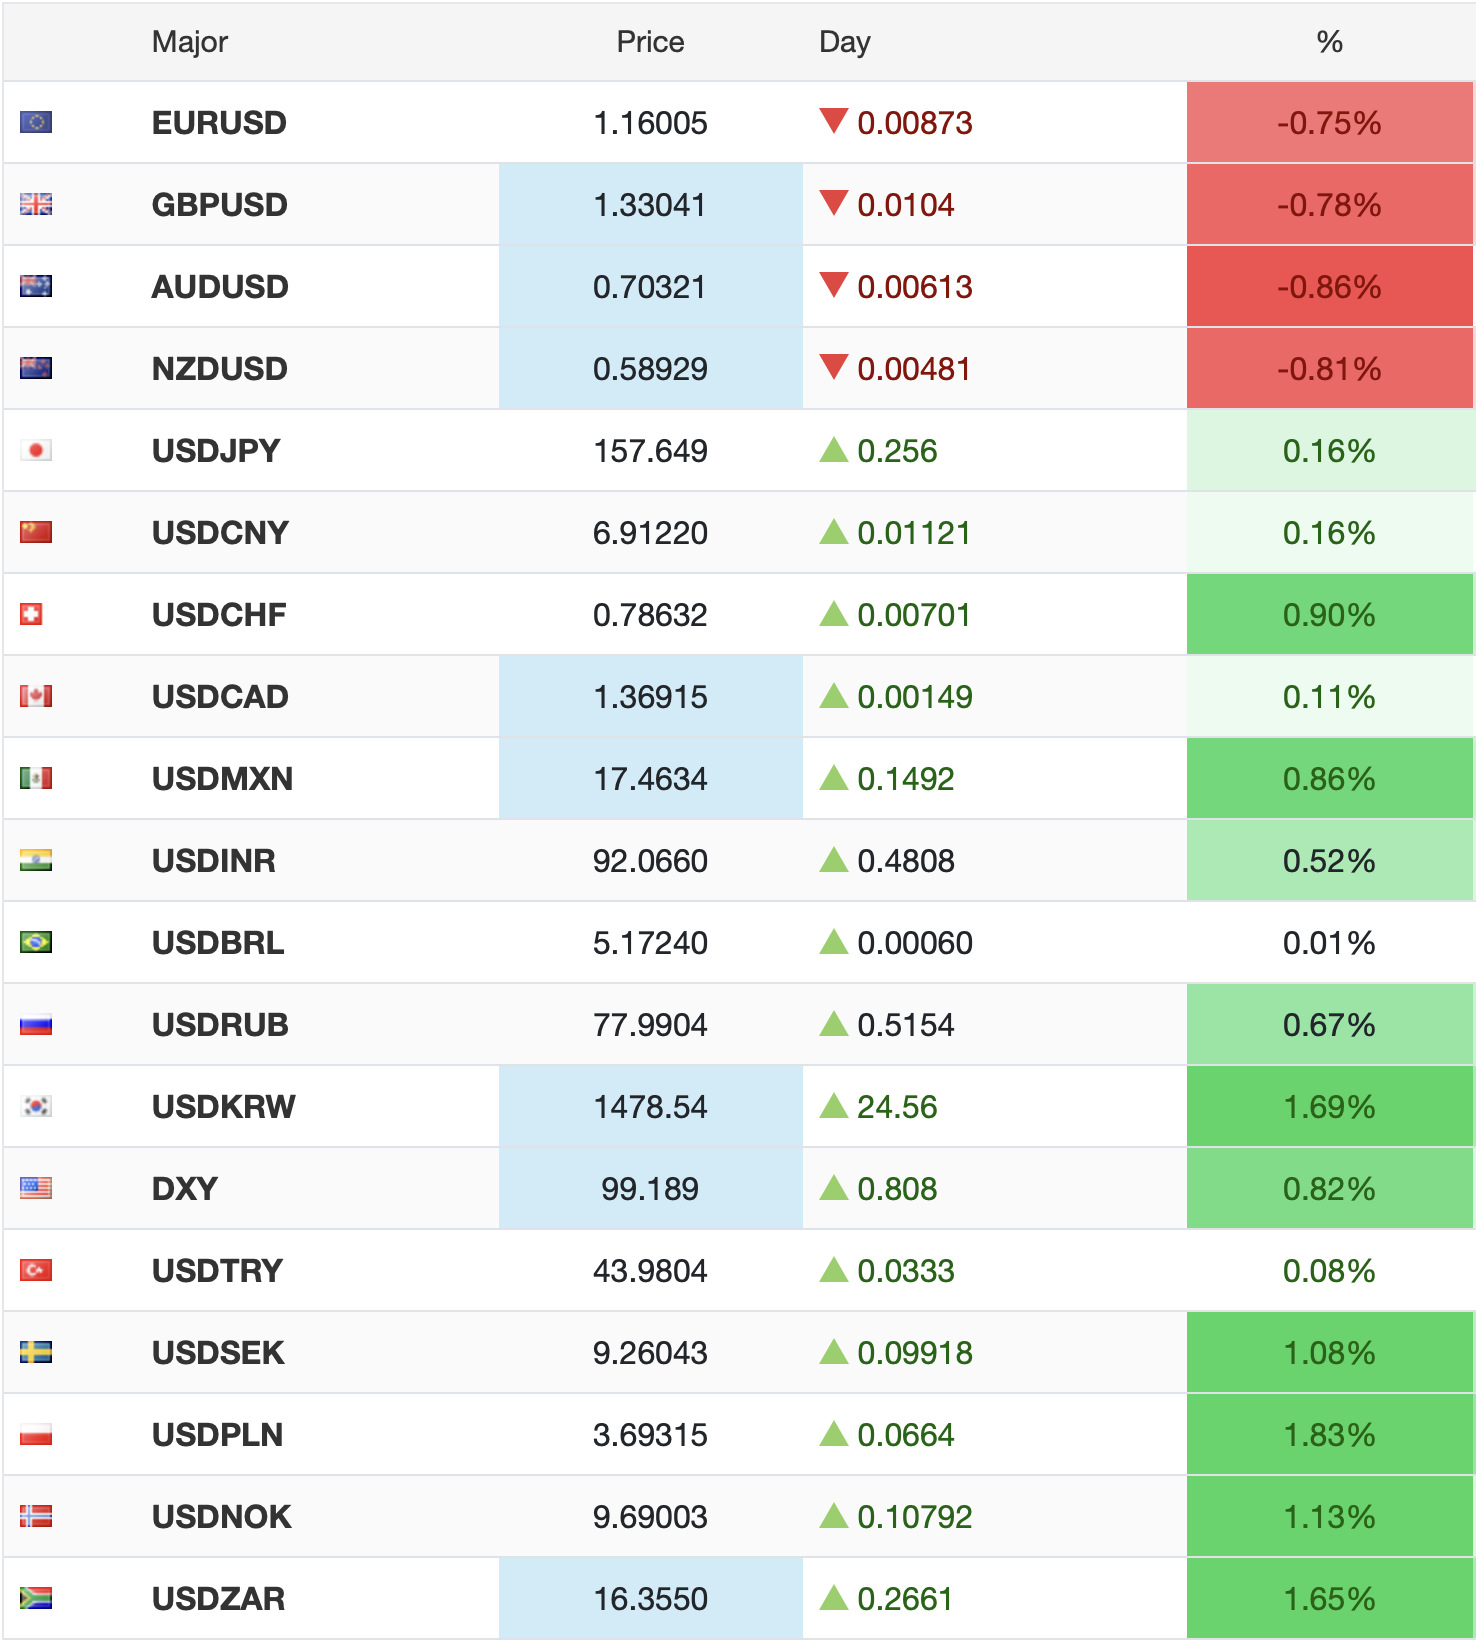
It was just over a month ago when the cognoscenti were explaining that the euro above 1.20 was indicative of the dollar’s long decline into the depths of history. I recall someone in my LinkedIn feed asking how soon the euro would trade through 1.25 and beyond. I would argue that timeline has been extended somewhat, if you still believe that is likely to be the case. Rather, as you can see in the below chart, the single currency (-0.8%) is now back below 1.1600.
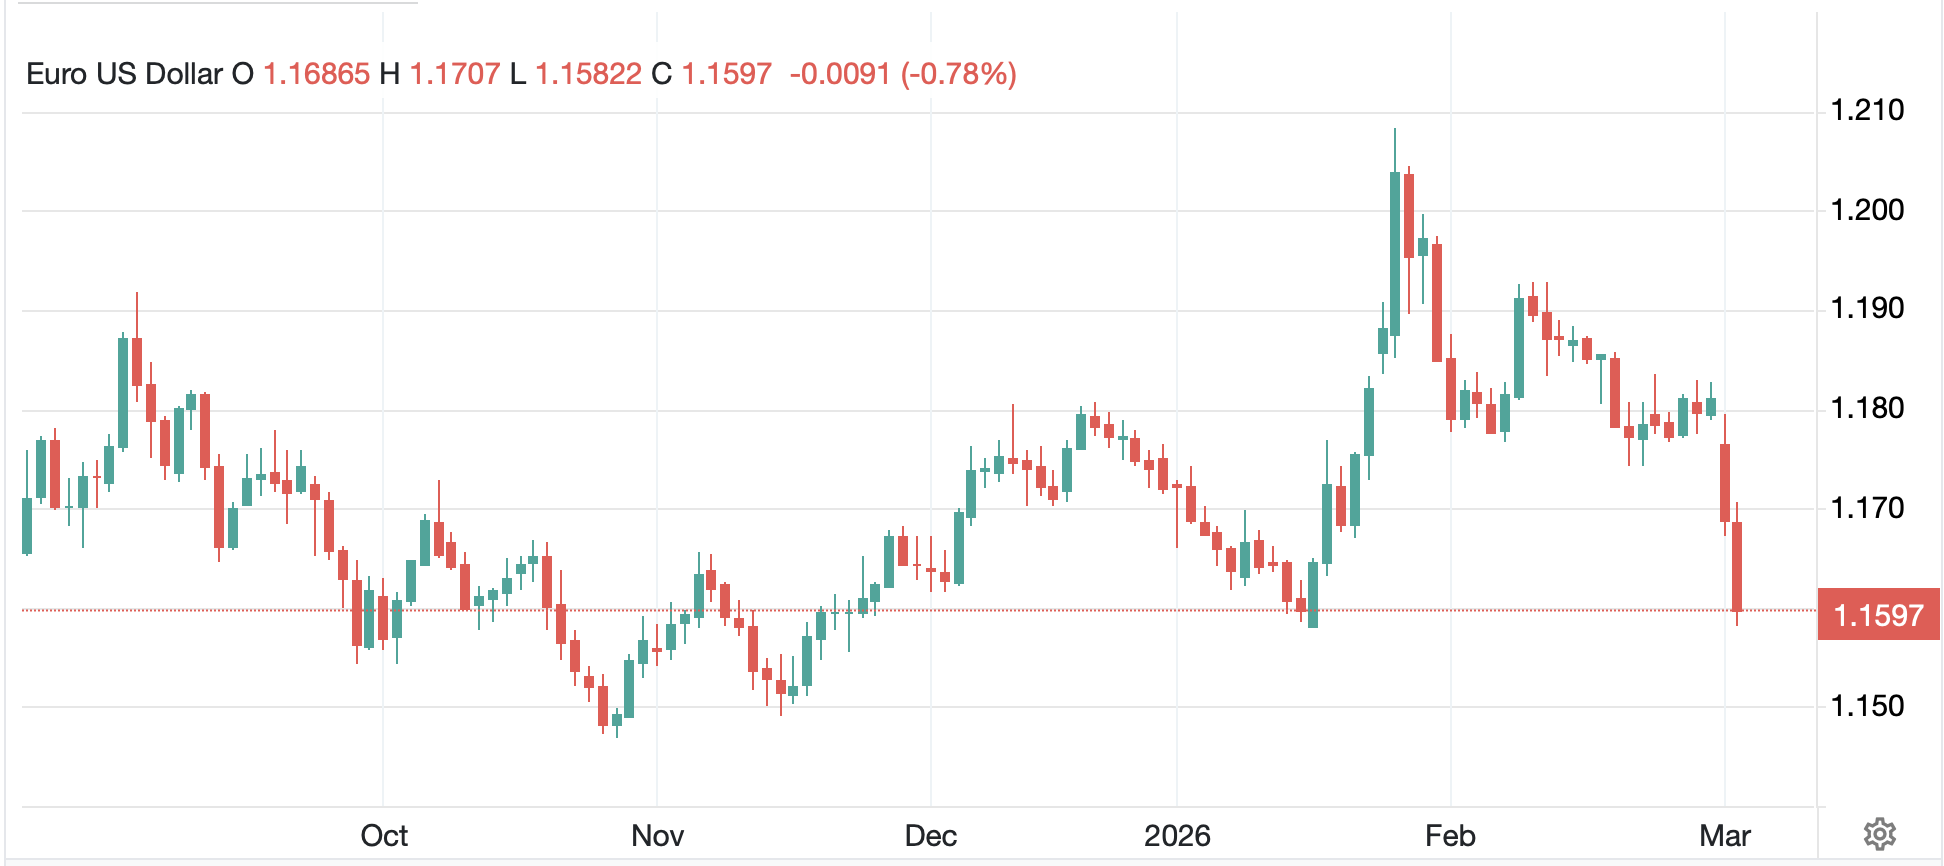
Source: tradingeconomics.com
There are several things weighing on the euro right now. First is the fact that they are energy price takers for every form of energy, so not only are higher oil prices hurting the continent, but NatGas there has exploded higher as per the below chart, rising 37% today and nearly 95% since the weekend.
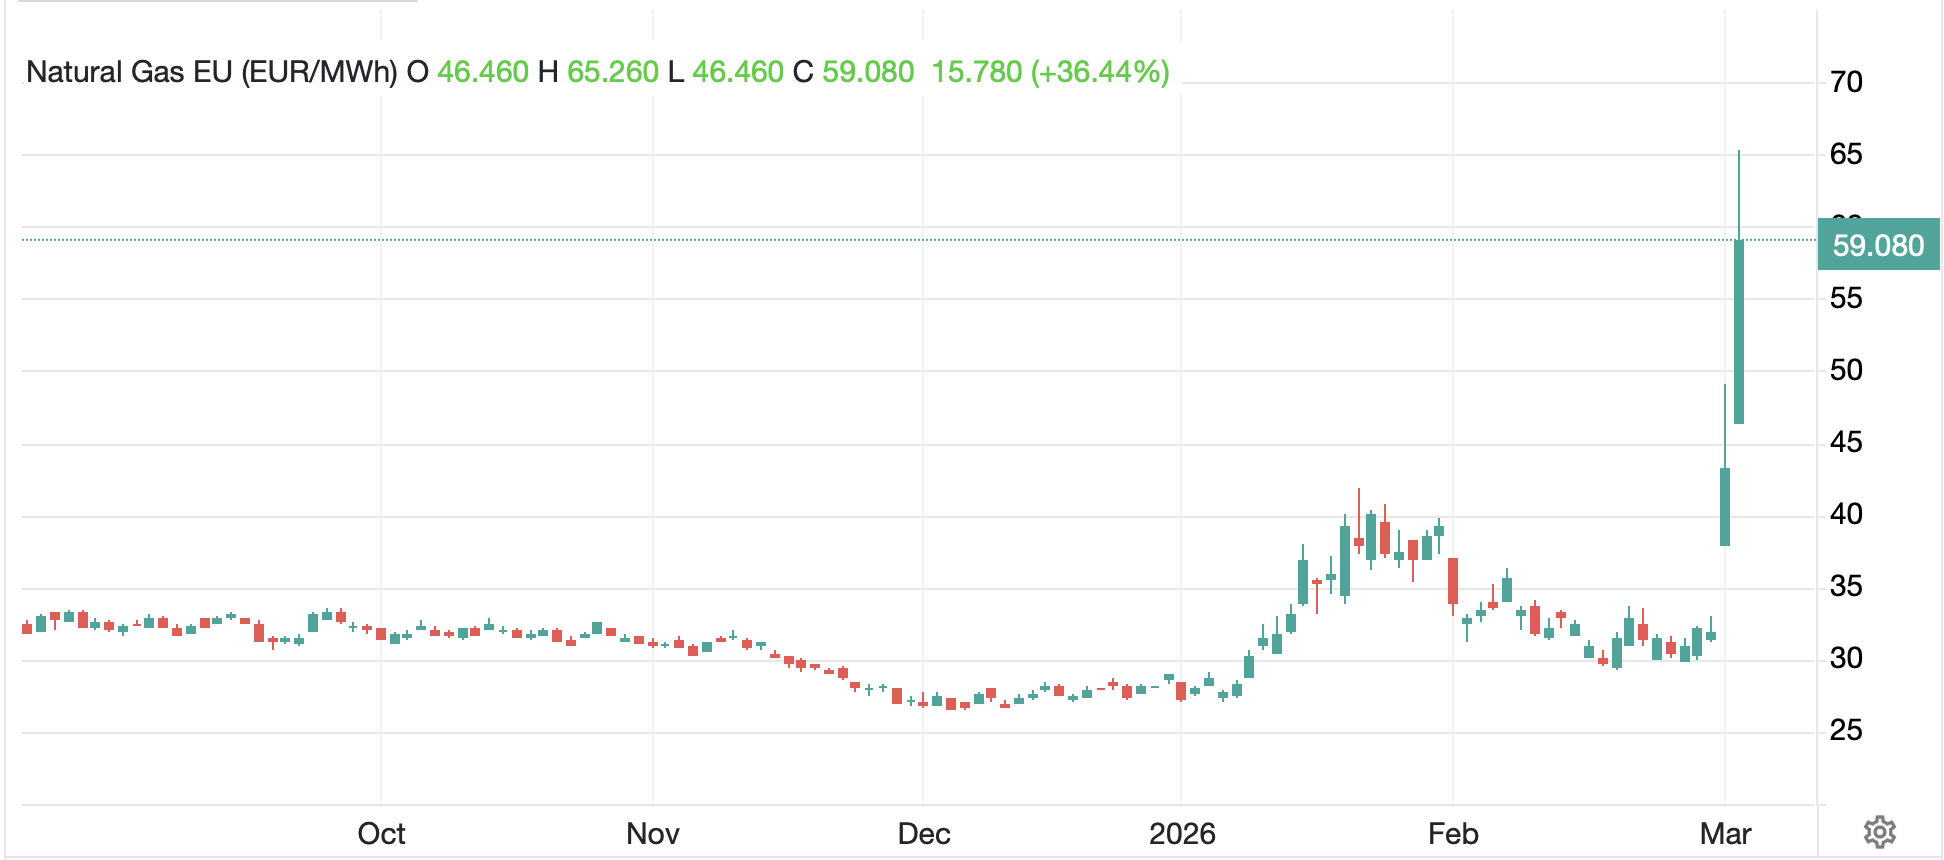
Source: tradingeconomics.com
Recall, Europe has been trying to wean themselves off Russian gas, have been huge buyers of US LNG but also huge buyers of Qatari LNG, and with the Strait of Hormuz effectively closed (shipowners cannot get insurance so nobody transits the Strait), this is a problem. Adding to the European problem is the fact that their storage levels of NatGas are extremely low for this time of year, about 30%, when typical levels in early March are near 50%. We cannot be surprised at this price action. So, while US NatGas (+6.3% this morning, 10% this week) has risen, it is currently trading at $3.14/MMBtu. The comparable Eurozone price is $20.28/MMBtu. Perhaps a weaker euro is not that surprising after all. (As an aside, one of the reasons I find it difficult to accept the weak dollar story is that the US controls its own energy destiny and given energy is life and the economy, we are fundamentally in better position to perform going forward.)
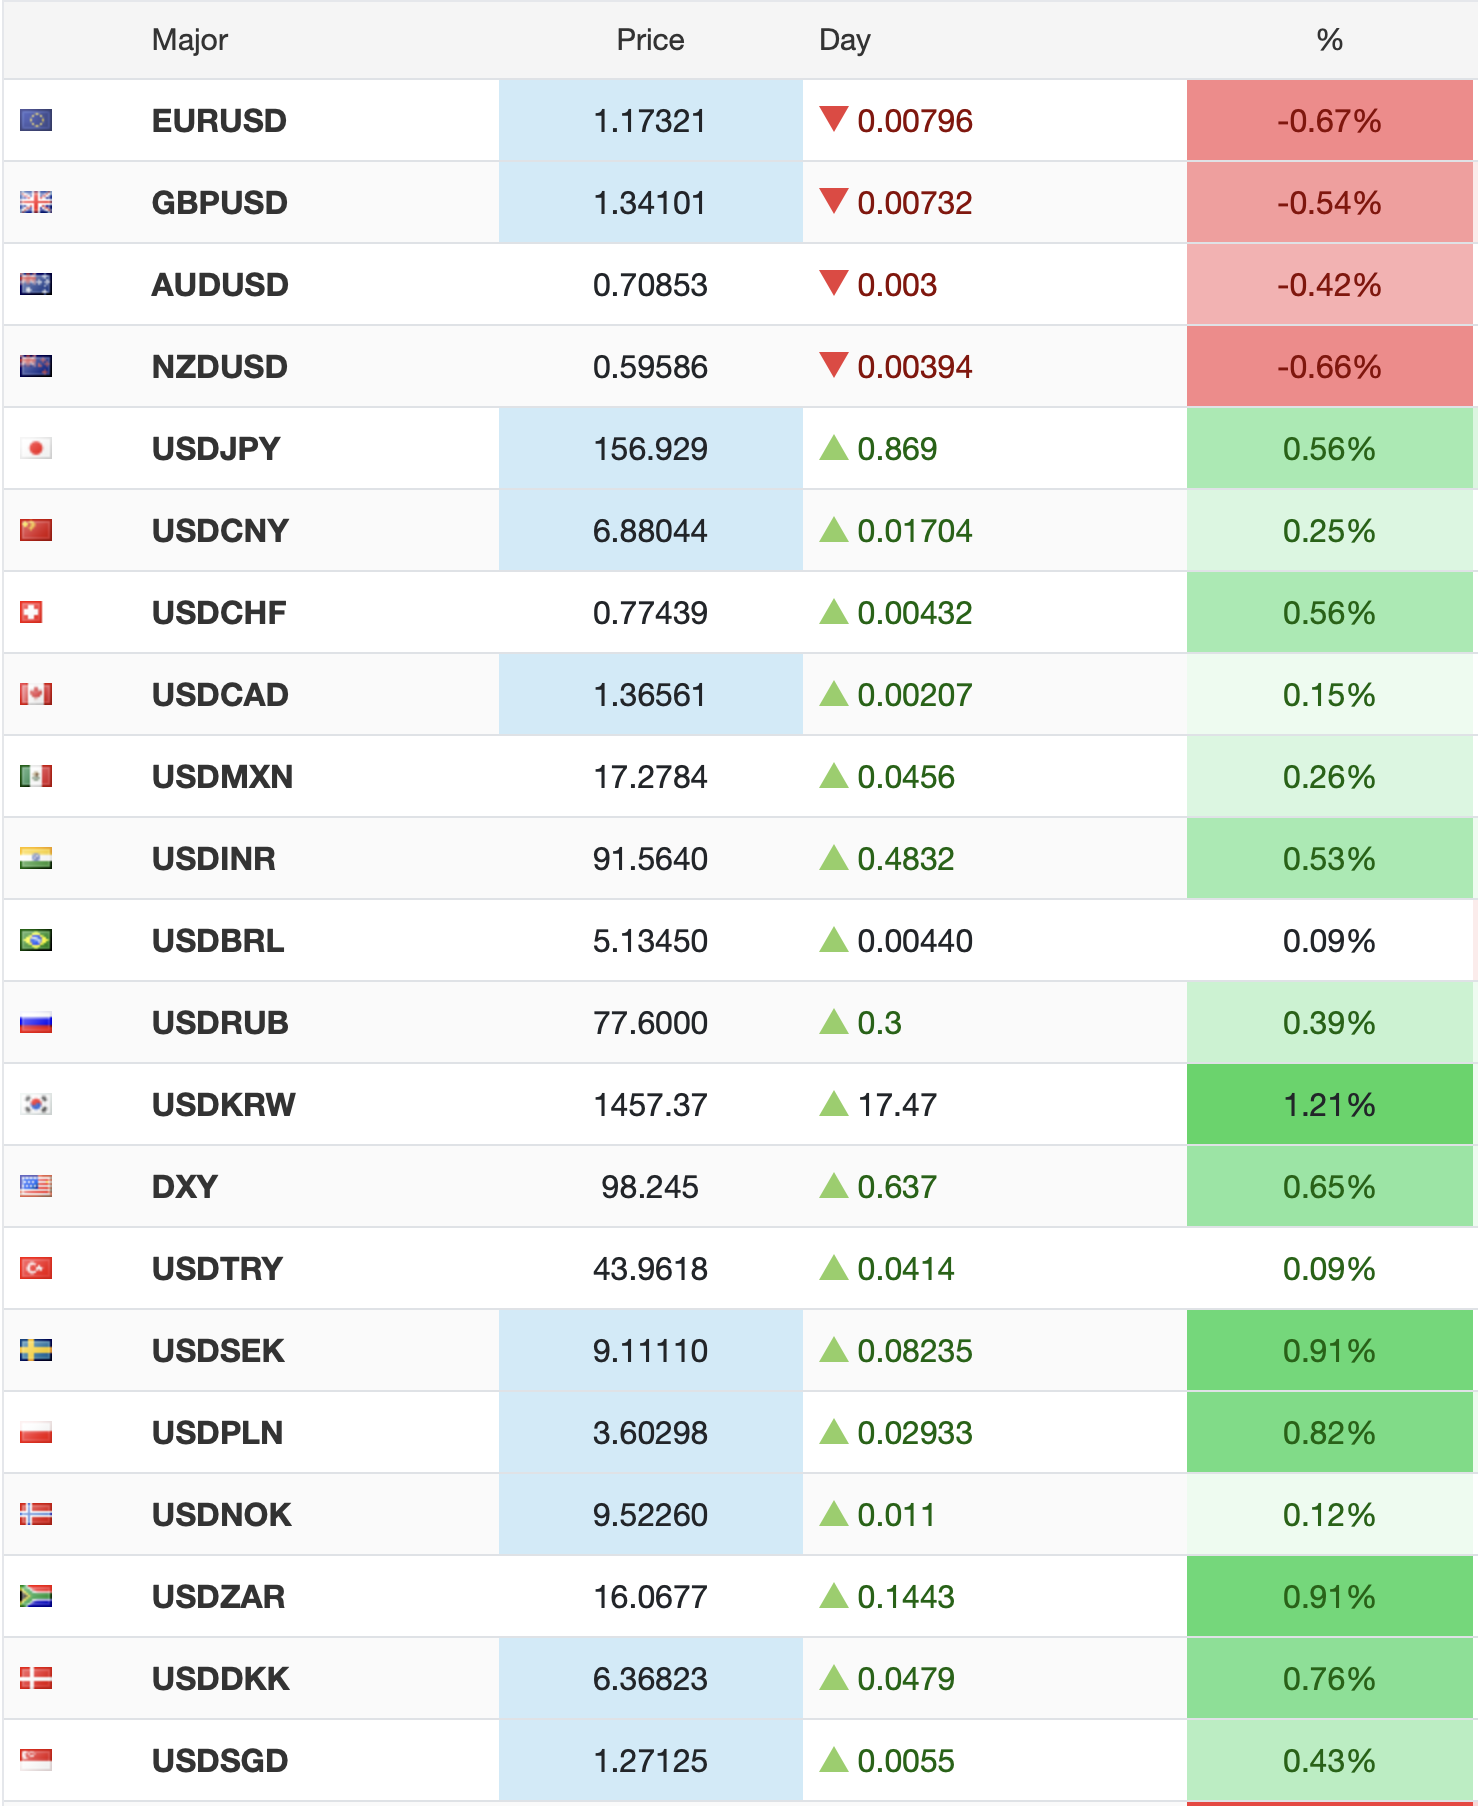
But the dollar is strong against all comers again today as per the below table from 7:10 this morning. Will this continue? While nobody knows, my take is there is still ample room for further strength in the buck, probably another 3%-5% before it starts to impact other things significantly.
Source: tradingeconomics.com
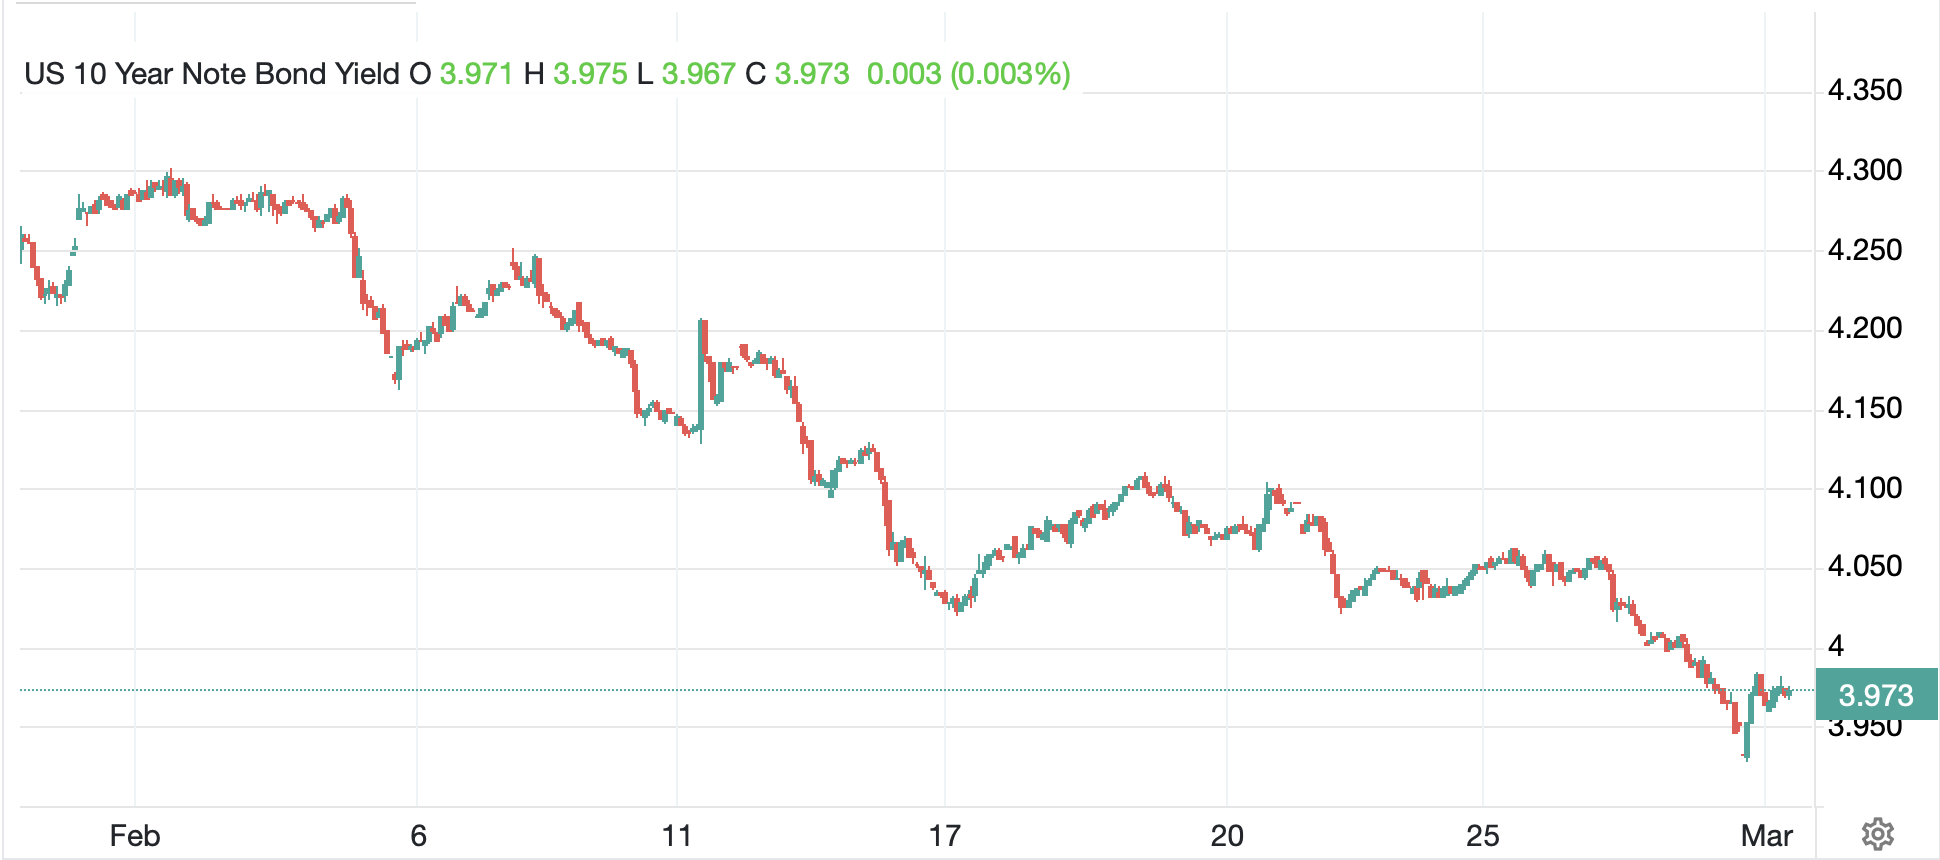
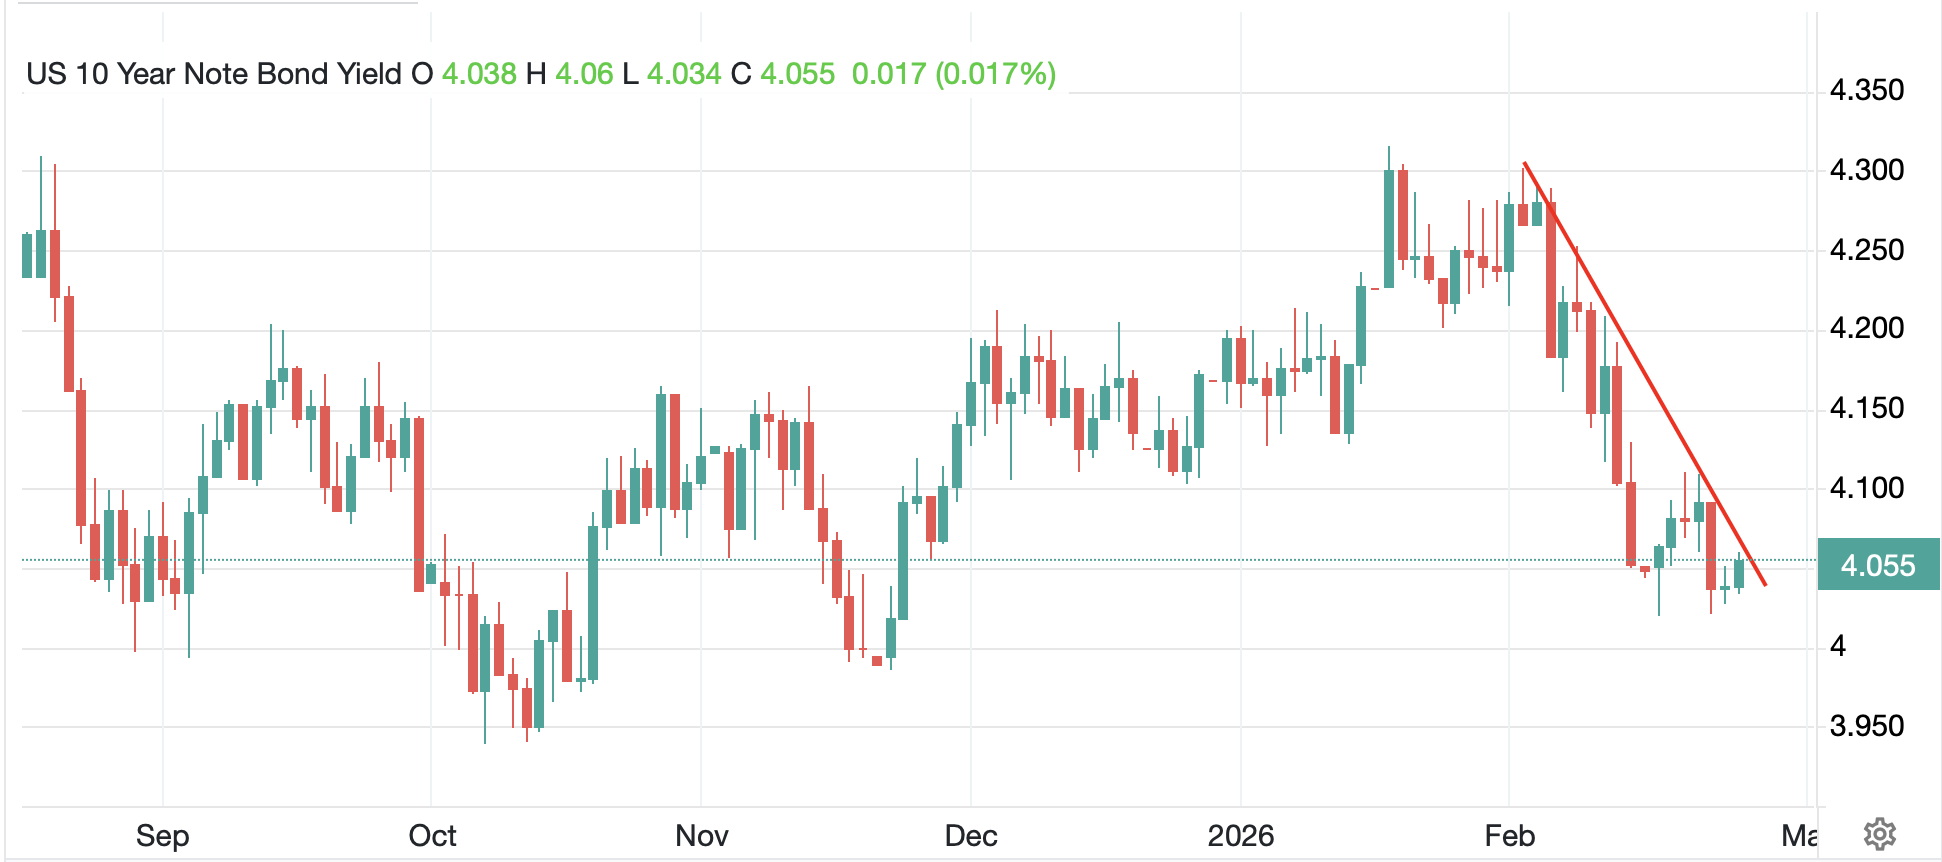
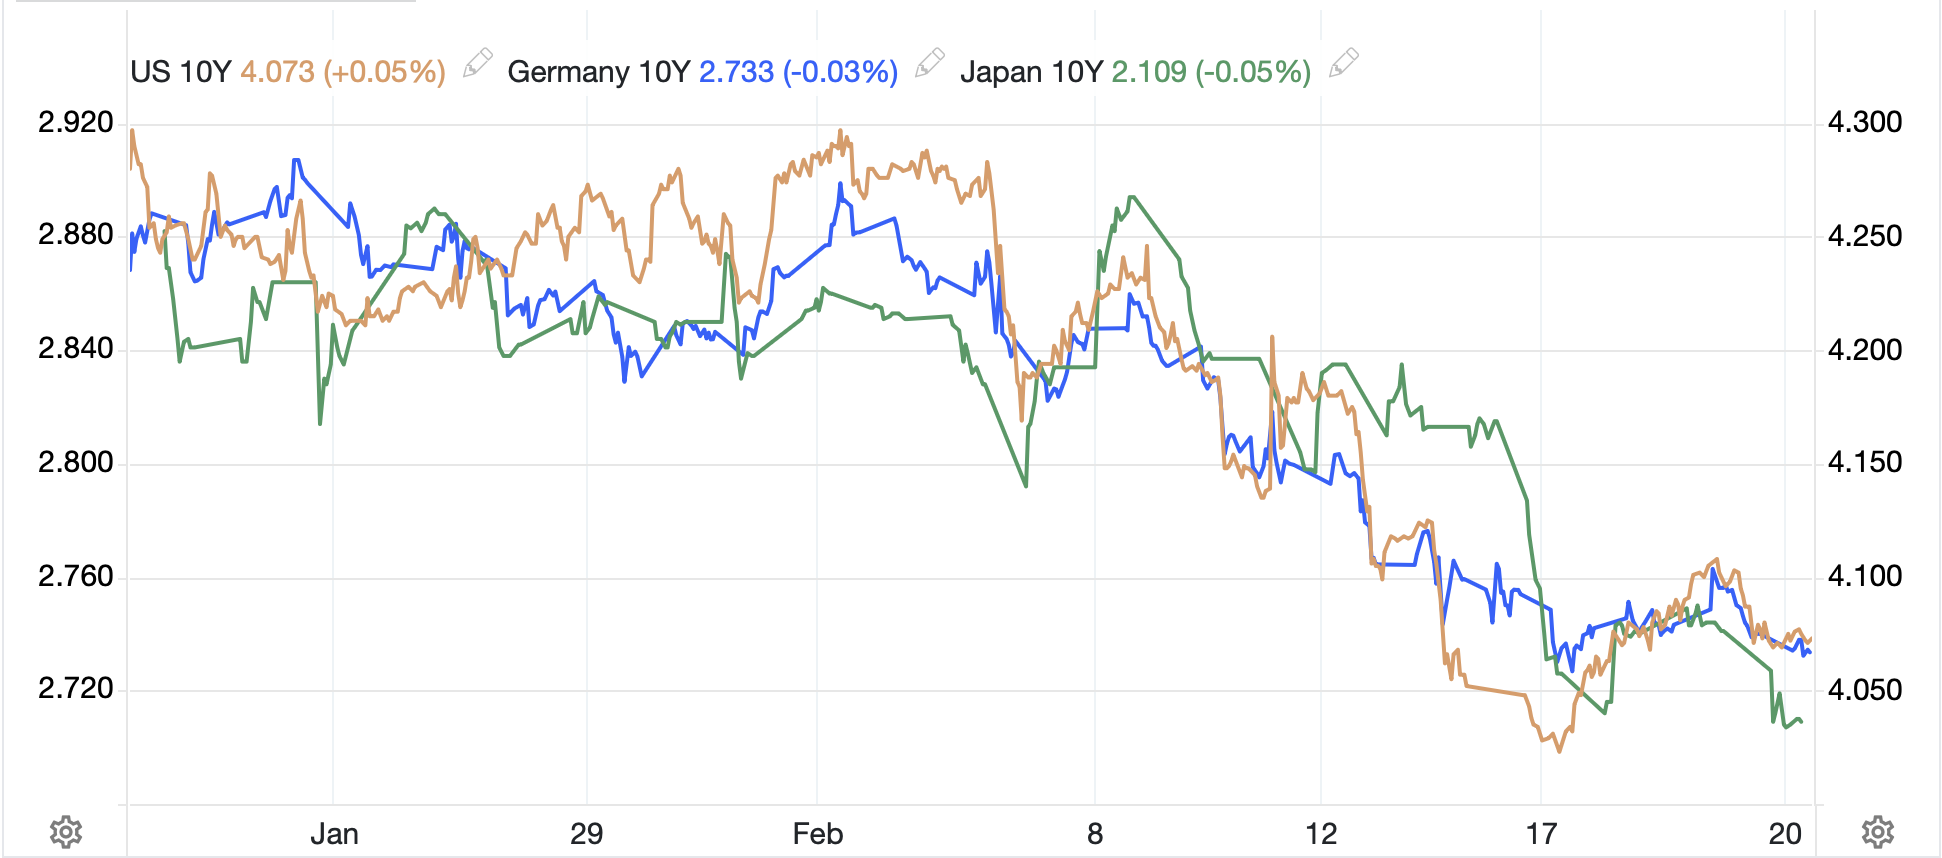
I think the biggest surprise for most of us is the incredibly poor performance of the bond market, which has always been seen as a safe haven. However, this morning, that is not the case at all as you can see from the Bloomberg table below.
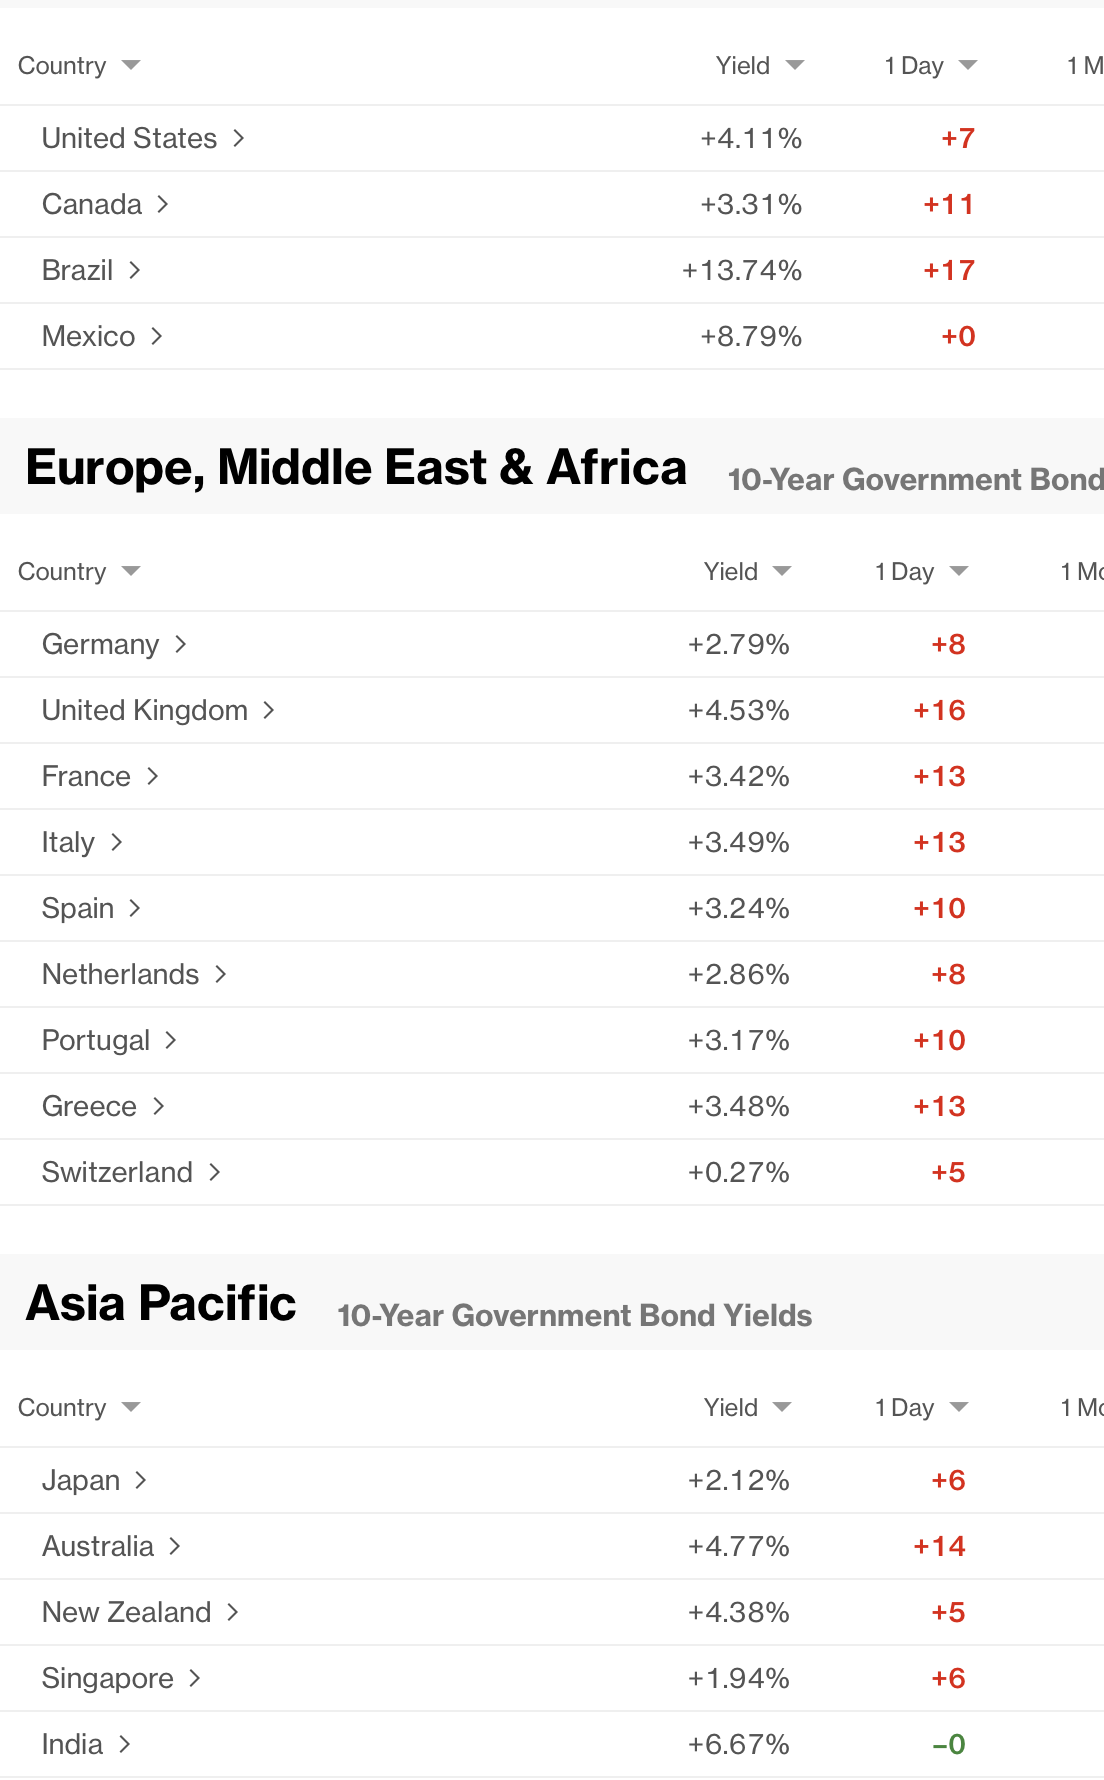
My take is that there is only one thing we truly know about war, it is inflationary. While the early signs are for energy prices to rise, war is a major consumer of resources that will never be recycled and therefore will require new baseline production. As well, governments don’t fight war on an austerity budget, so you can be sure that there will be plenty of money around. All that leads to higher prices and that is why bond markets are feeling pain around the world this morning. If, as President Trump has indicated, this war ends in the next 4 weeks or so, we will be able to re-evaluate the inflationary and other impacts, but while I had thought bonds were going to perform well, clearly that is not the case right now.
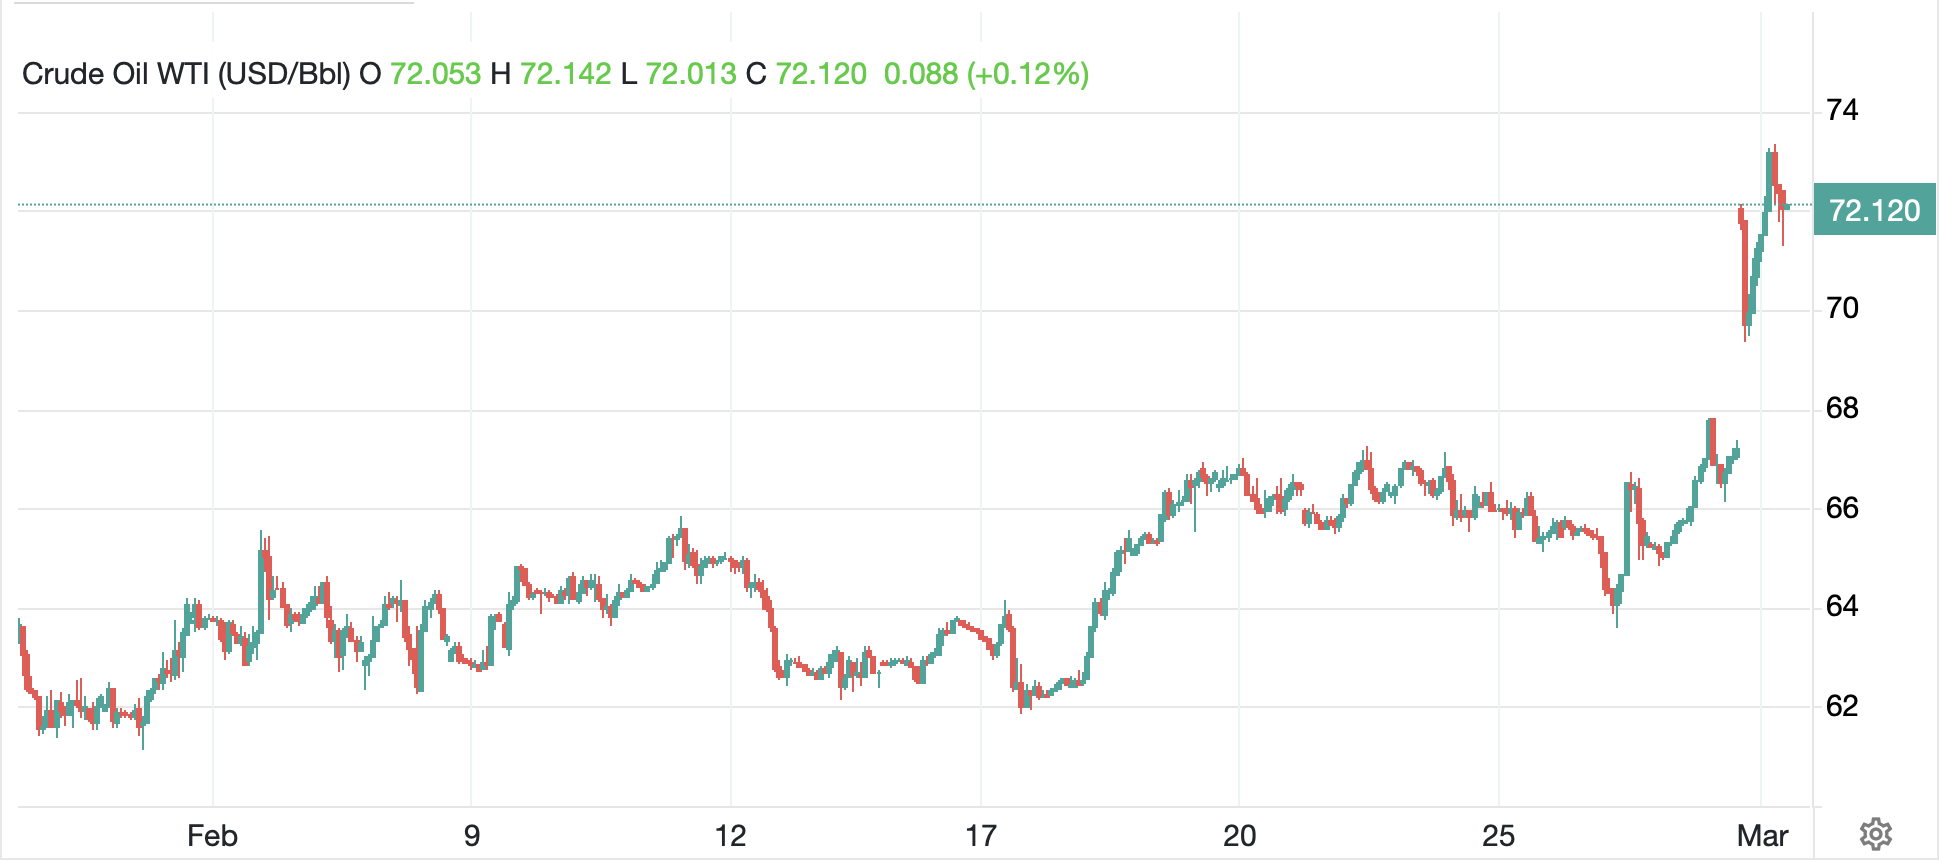
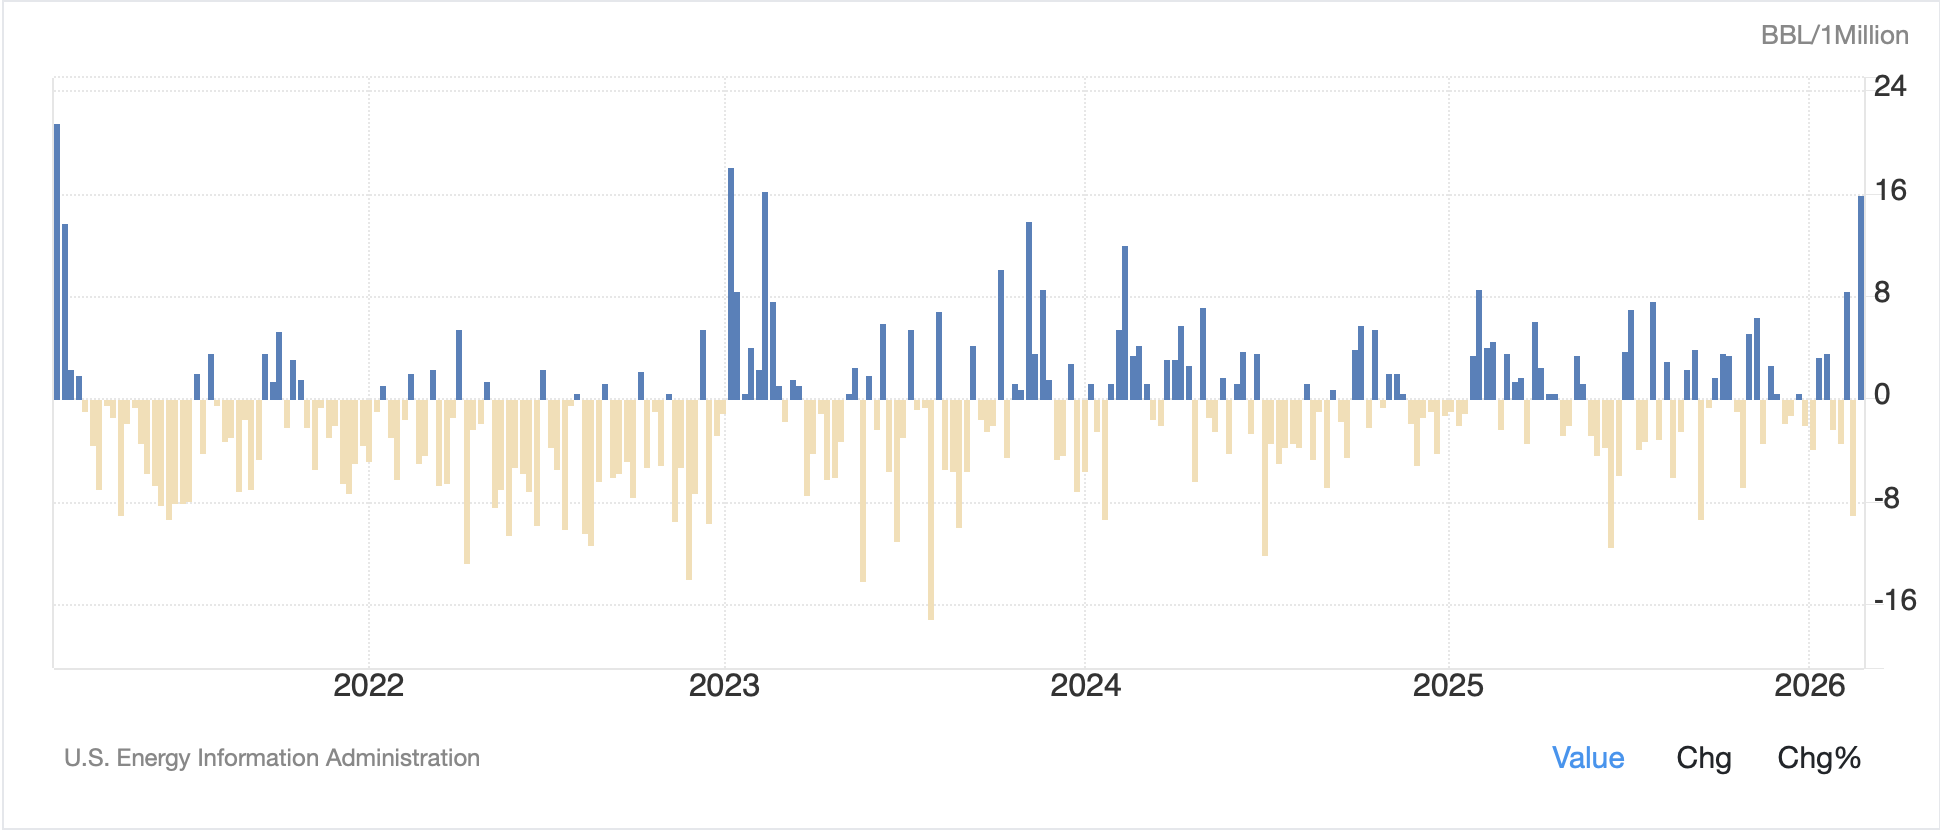
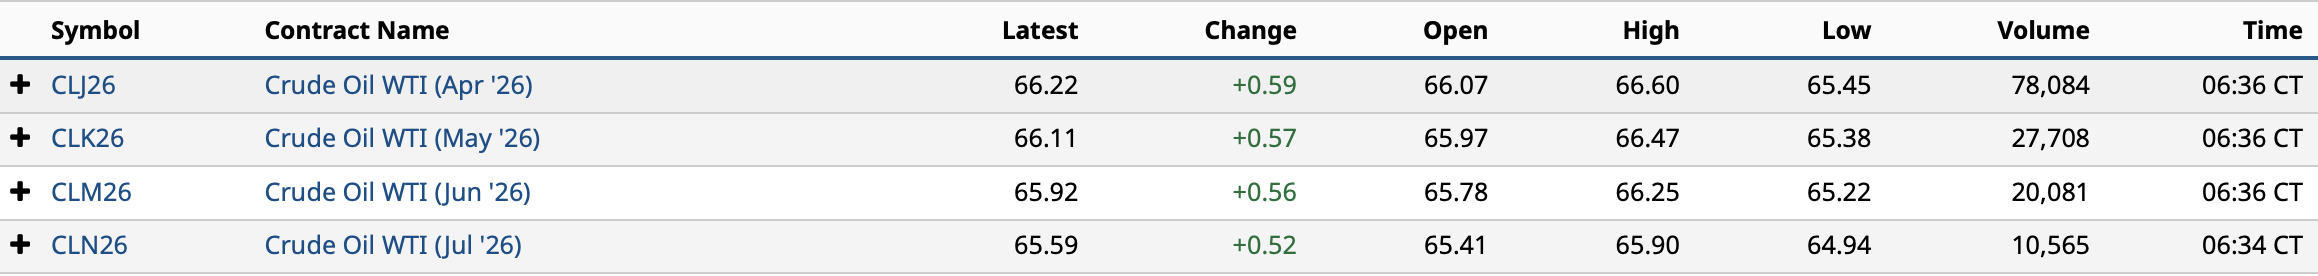
Turning to commodities, oil (+6.75%) continues to rise and I expect will remain well bid until the fighting stops. The prospects for higher prices from here remain dependent on whether Iran tries to destroy other Middle East production facilities and if they are successful. Meanwhile, in the Western hemisphere, the US, Canada, and all of Latin America are going to be pumping at full strength for now. So, while prices may tick higher, it is unlikely we will see any supply issues here.
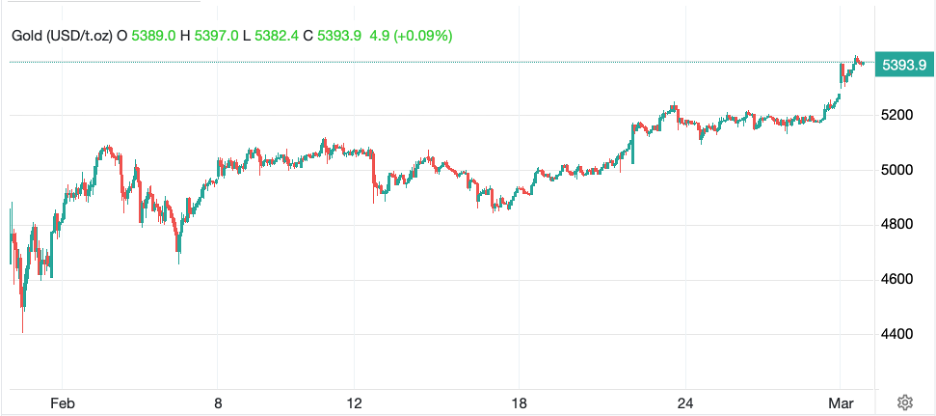
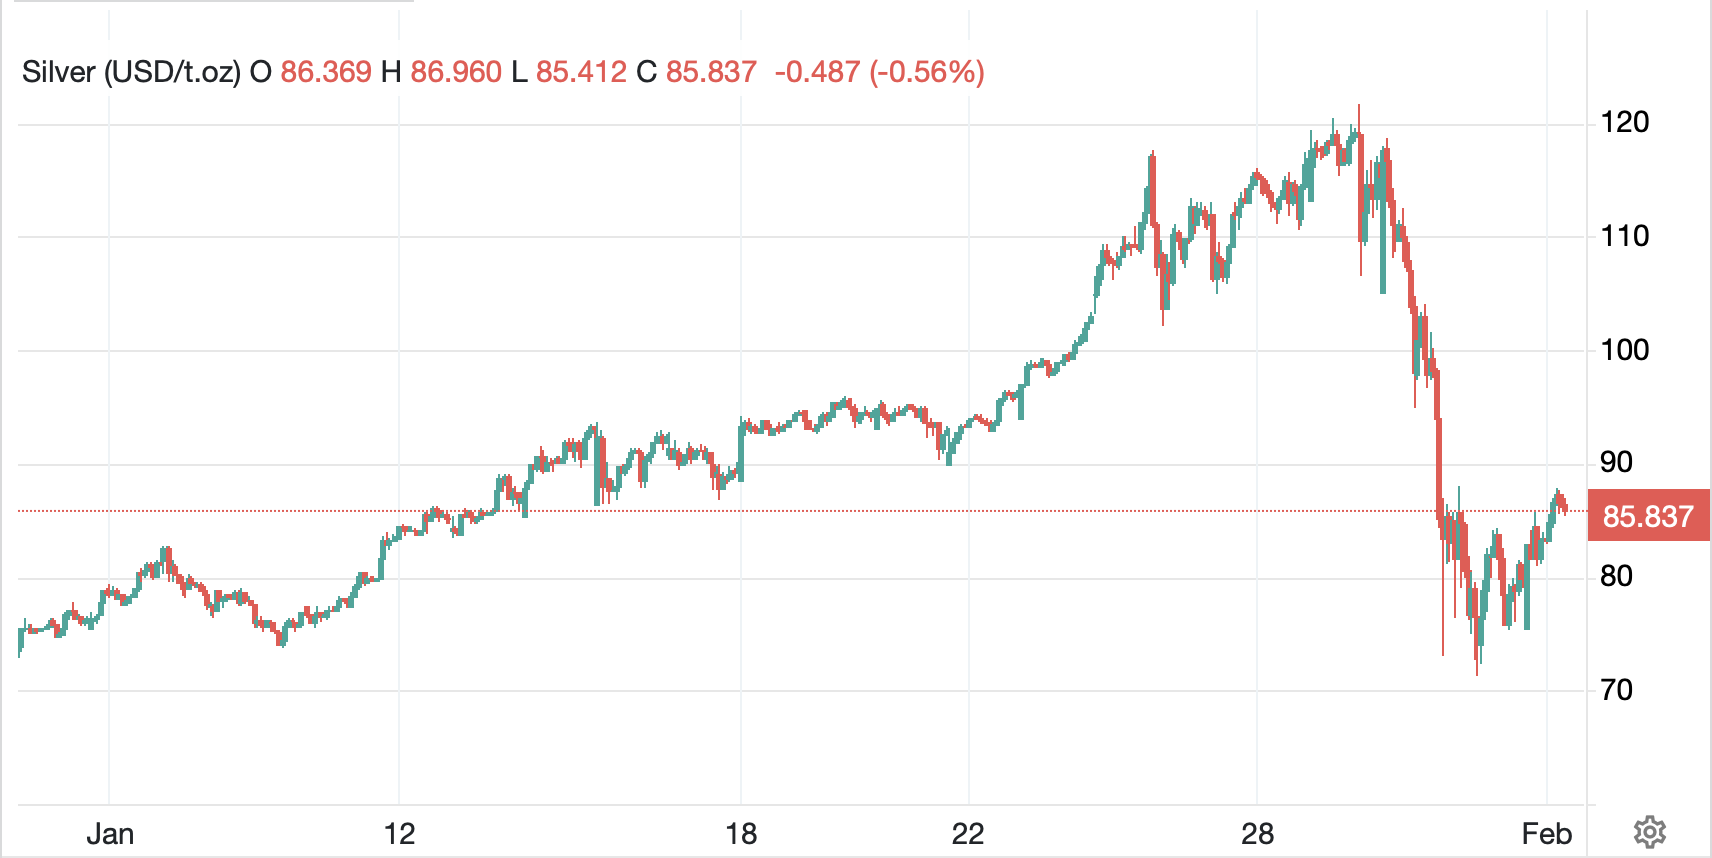
Metals are another surprising trade this morning with gold (-2.65), silver (-7.8%) and copper (-2.3%) all sharply lower. Given the sharp decline in equity prices I will discuss below and given the amount of leverage that is rampant in the equity markets, I think gold is a victim of ‘sell what you can, not what you want to.’ Arguably, there is some of that with bonds as well. In a way, though, I am more surprised about silver and copper given their criticality in fighting the war. Both are being consumed rapidly via weapons being deployed so this is more baffling to me. However, I do not believe the longer-term thesis in either of these metals has changed, there is a supply shortage relative to industrial usage for both with no new supply on the horizon. As such, I do see prices here rallying over time.
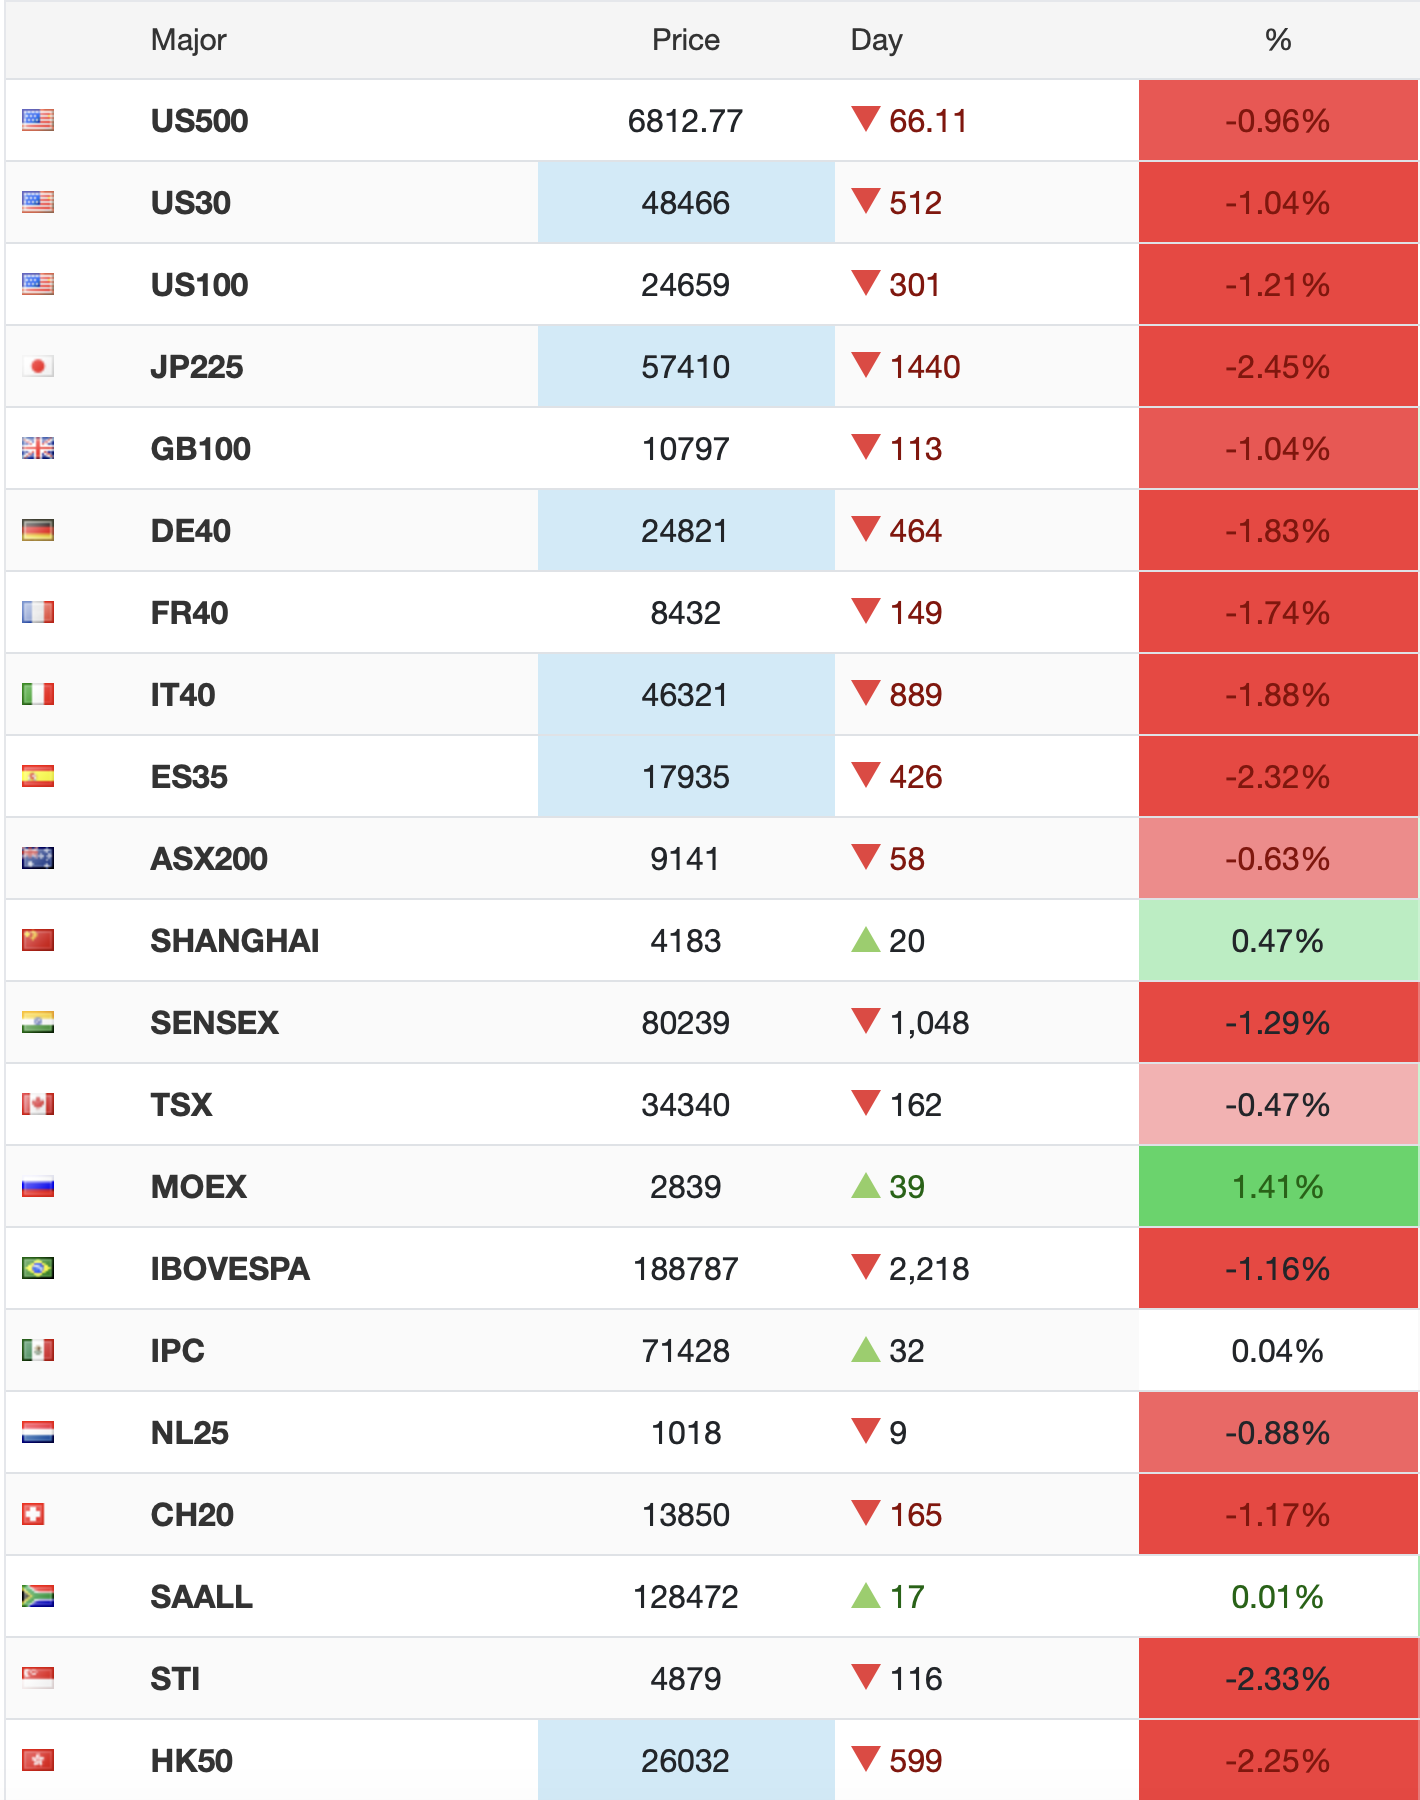
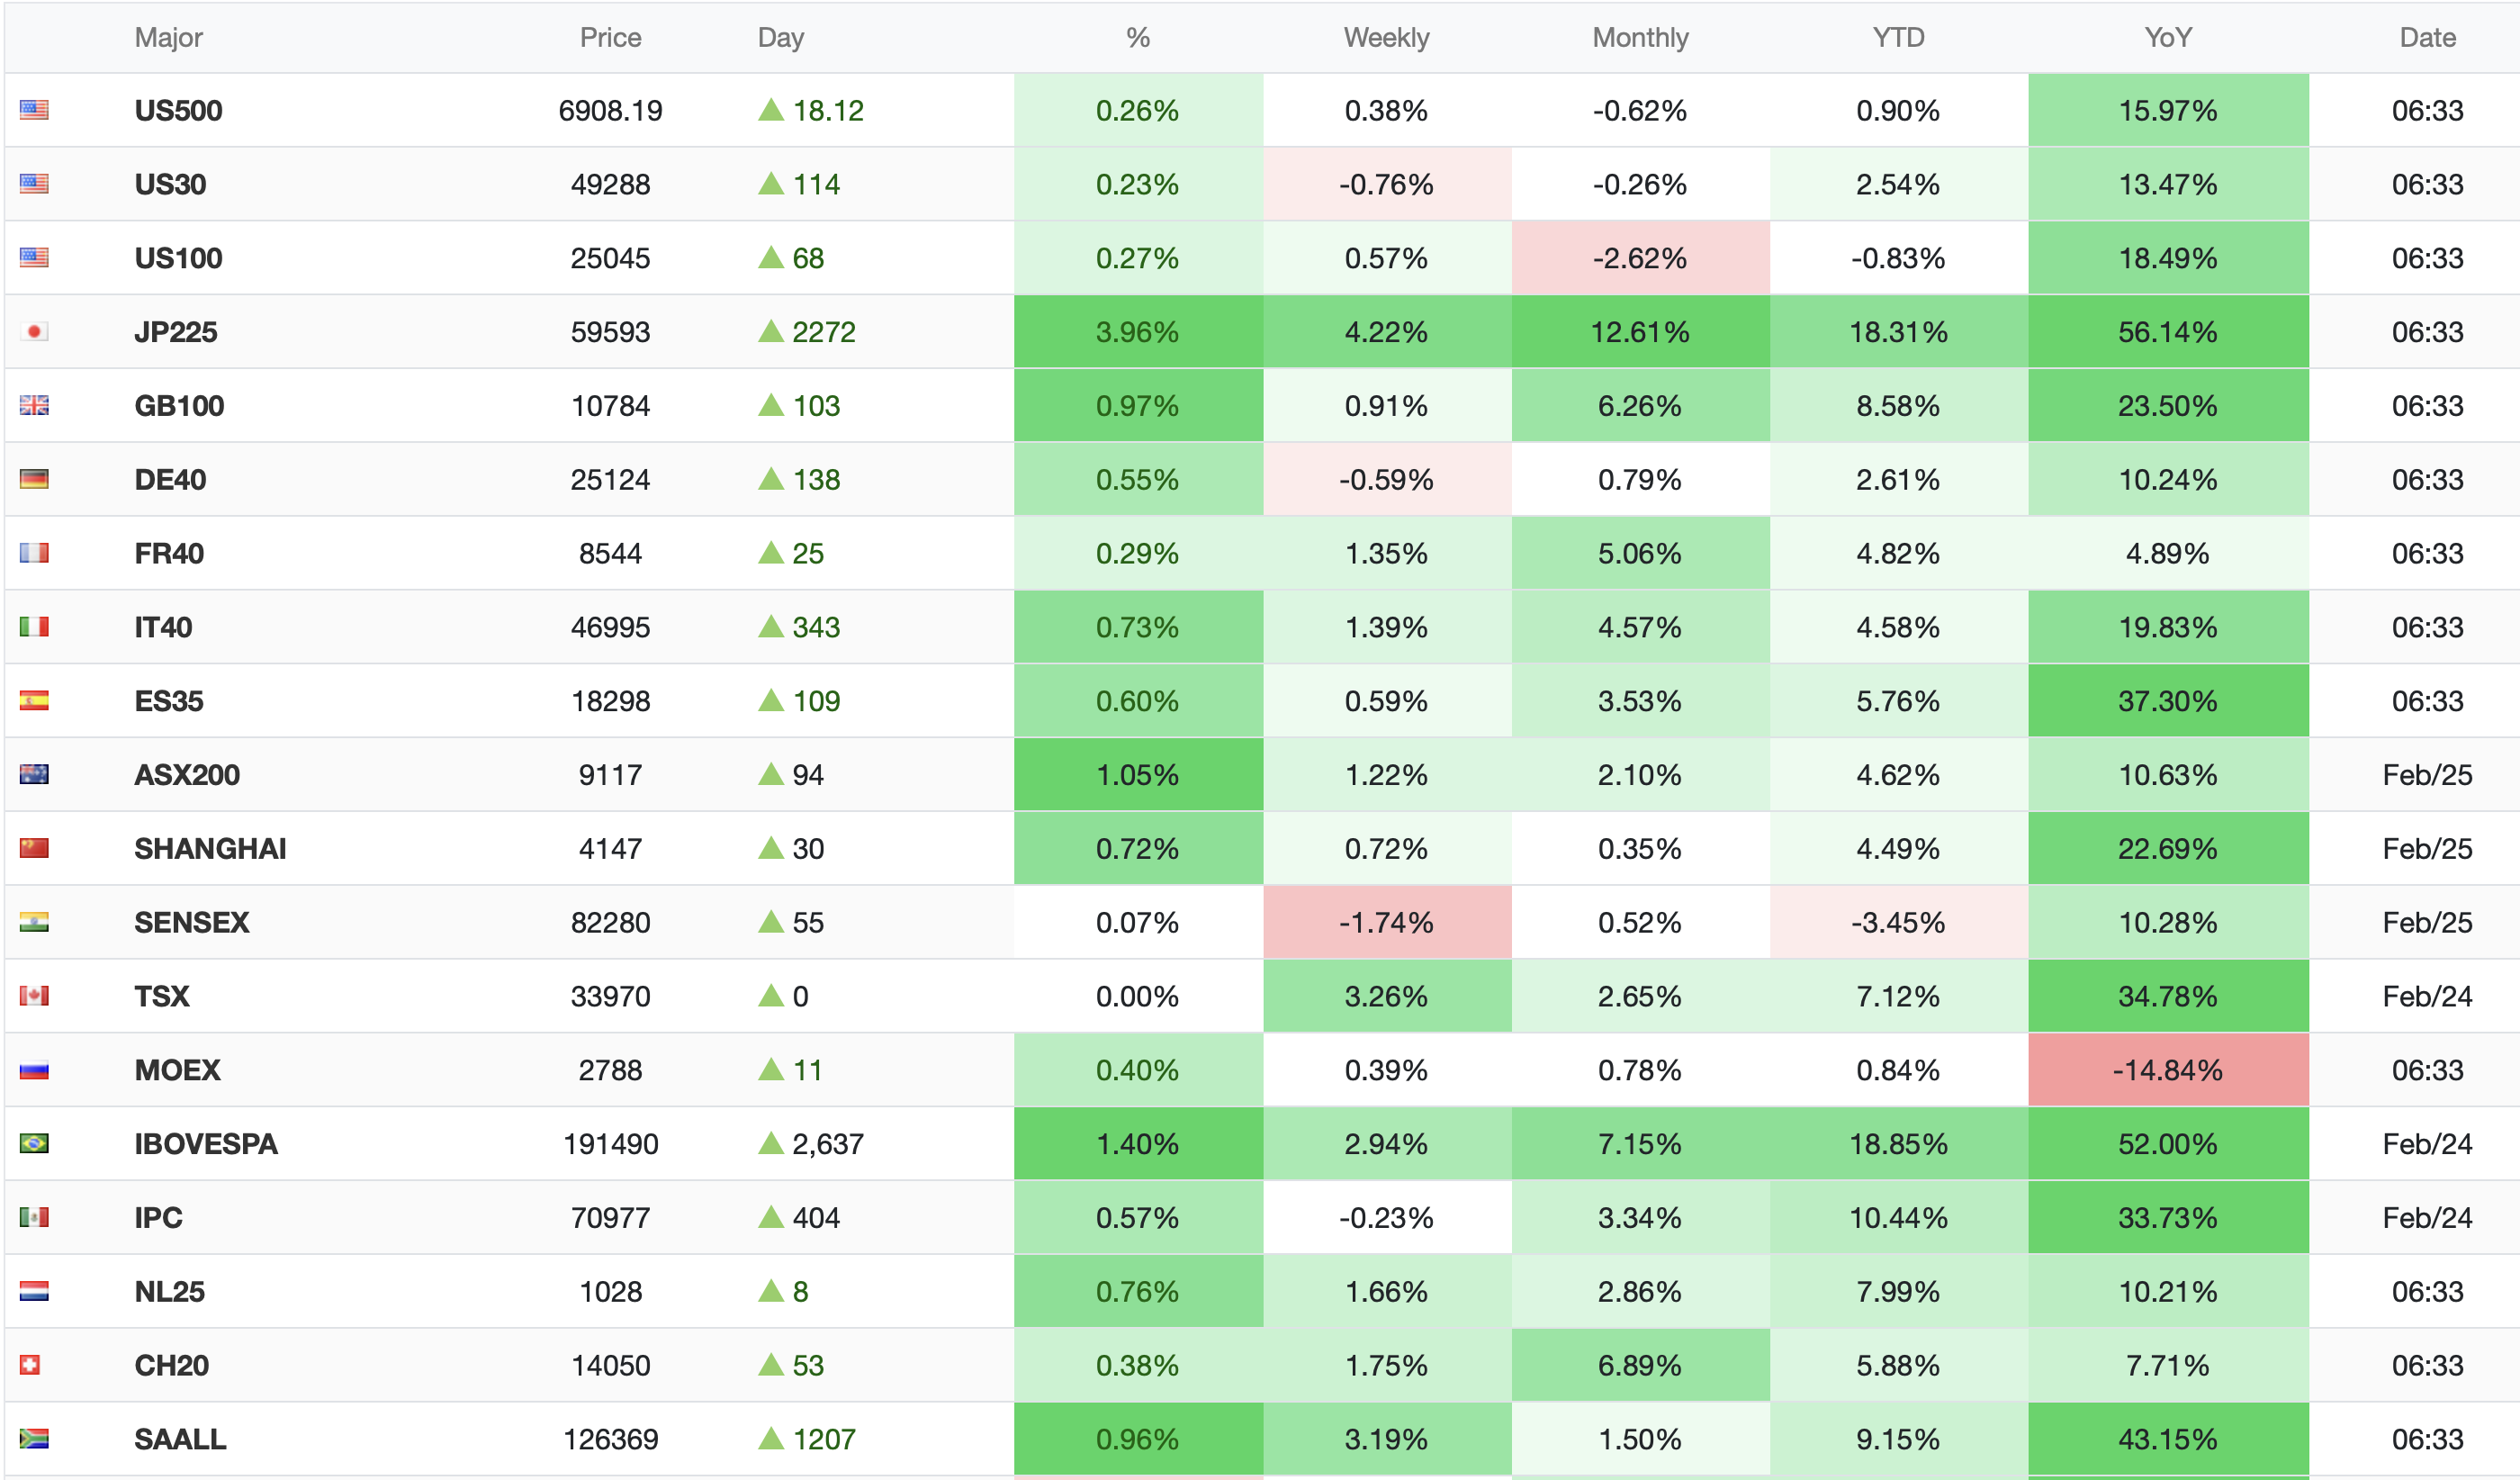
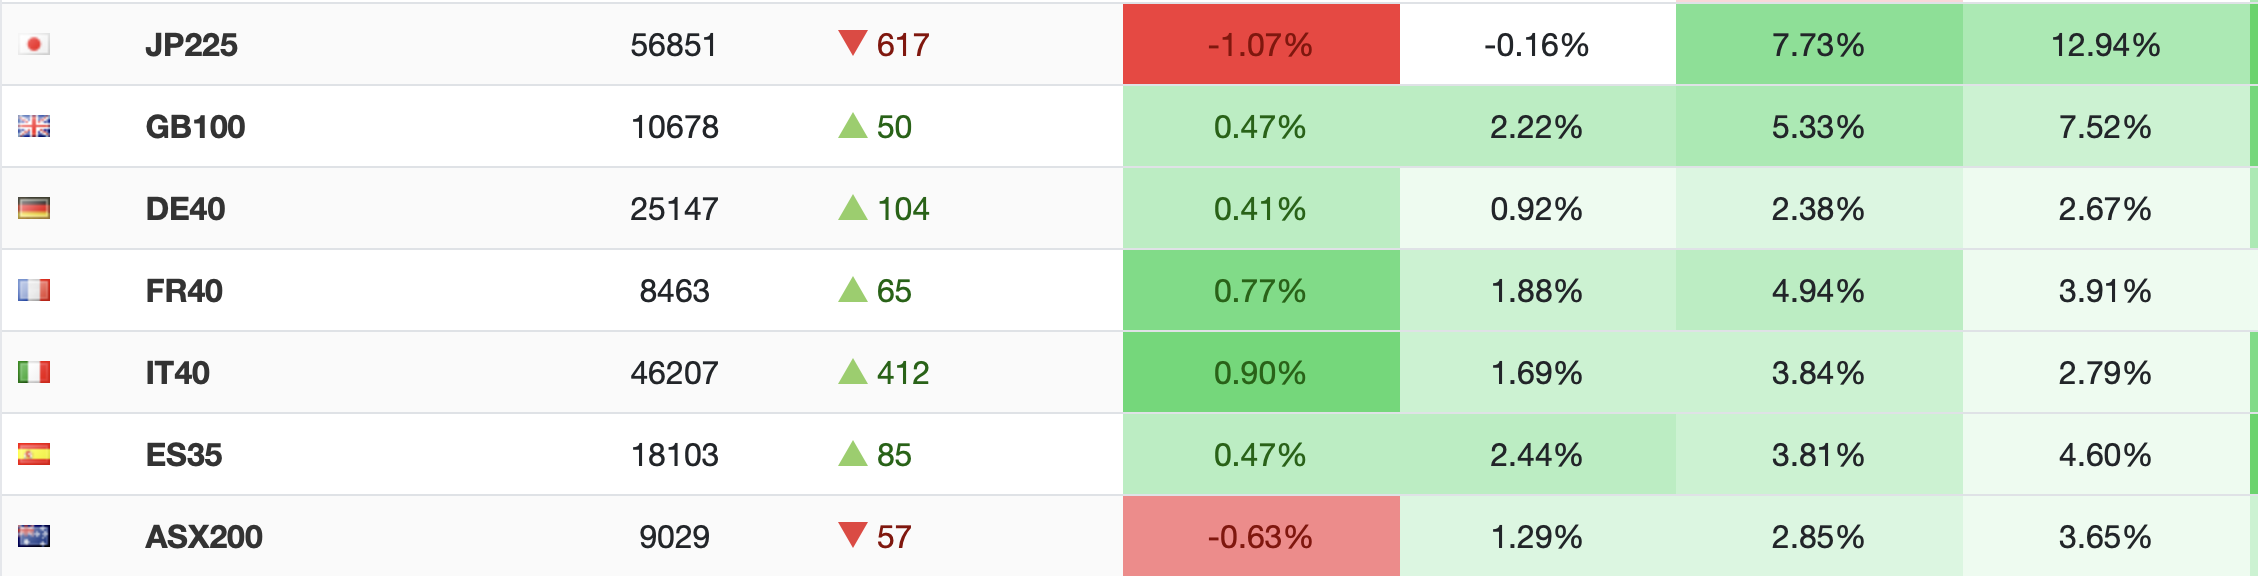
Finally, the equity markets are sharply lower almost everywhere. The below Bloomberg table shows how major markets in Asia performed overnight and how Europe stacks up at 7:30 this morning.
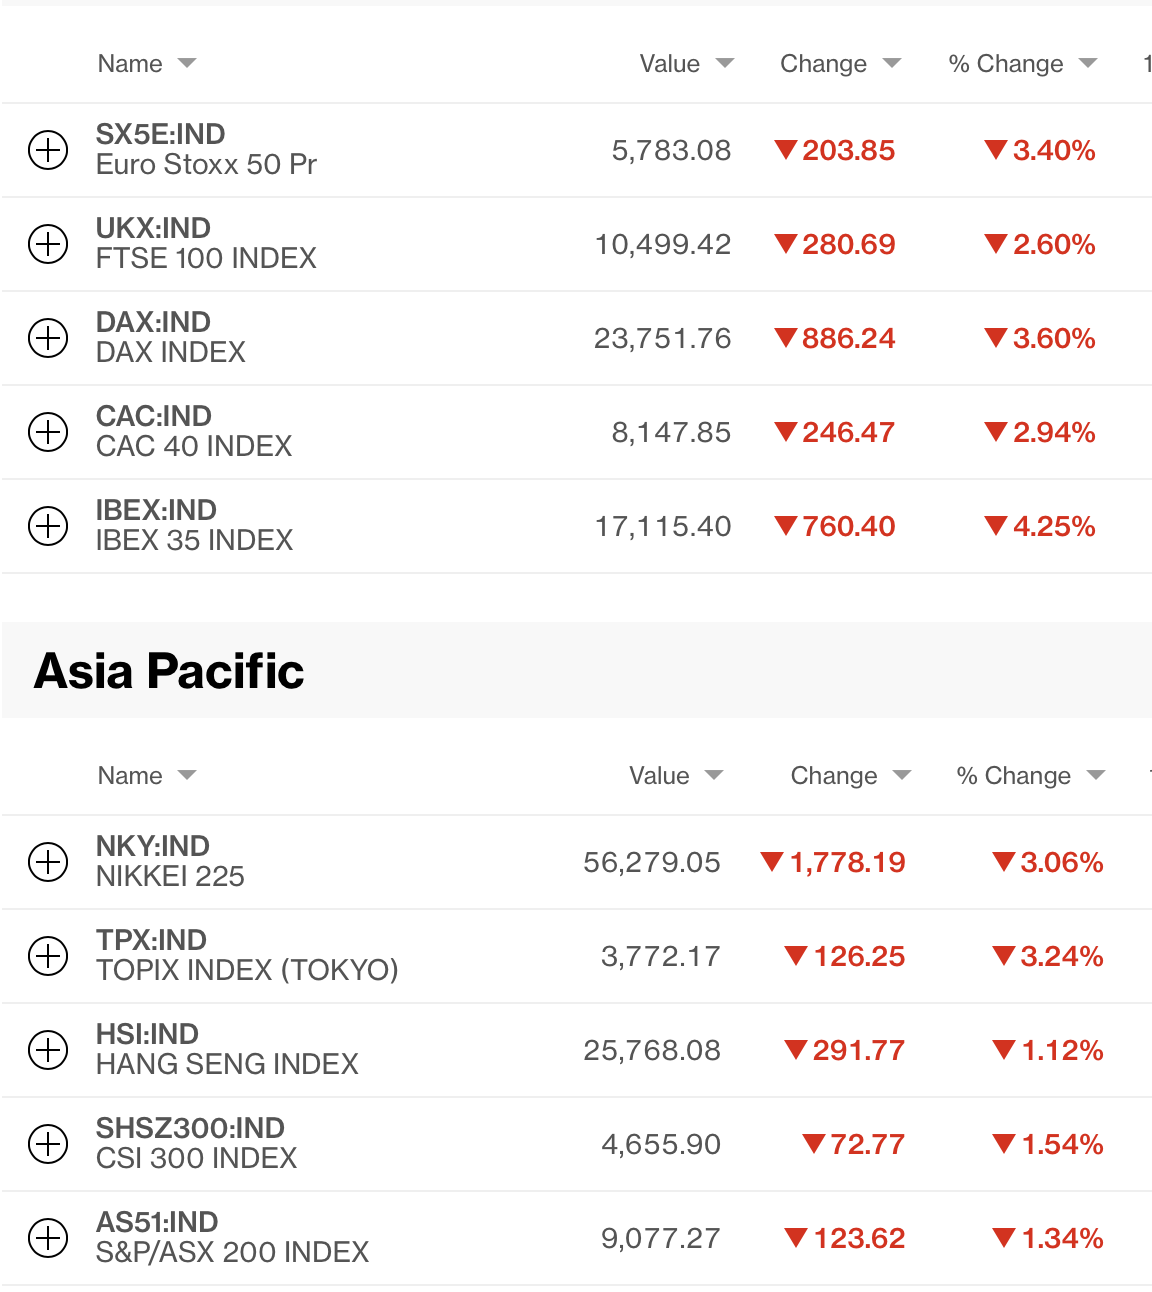
What it doesn’t show is that the KOSPI in Korea fell -7.25%, nor that there were sharp declines in India (-1.3%), Taiwan (-2.2%) and Thailand (-4.0%). You will also not be surprised that US futures are pointing much lower this morning, -1.5% across the board. Yesterday’s performance was quite the surprise, I think, but today is much more in line with what we expected.
And that’s where things stand this morning. obviously, the war is the only story that matters, so data releases are going to be secondary for now, even Friday’s payroll report. At some point, I expect that traditional havens will play their role, but as leveraged positions continue to get unwound, it may take a few more sessions before we see that. If you’re trading, smaller sizes make sense. If you’re hedging, stick to longer term fundamentals I think.
Good luck
Adf