Da Bomb

The payroll report was da bomb
But markets remained rather calm
So, what will it take
To get stocks to break?
If job growth leaves nary a qualm

Perhaps this week’s ‘flation report
Will frighten the risk averse sort
If prices jump higher
The bond market choir
Will trill for a hike, costs, to thwart

By now, you have heard about the blowout NFP report on Friday, where new jobs totaled 162K with revisions higher of the previous two months by an additional 55K.  This was massively above the expectations going in of 56K.  Perhaps even more surprising was the other survey, the Household survey from which the BLS calculates the Unemployment Rate.  While the rate was unchanged at 4.1%, employment (+569K) and the labor force (+683K) both rose sharply compared to recent reports, although it does appear this was a catch up from weaker earlier data.

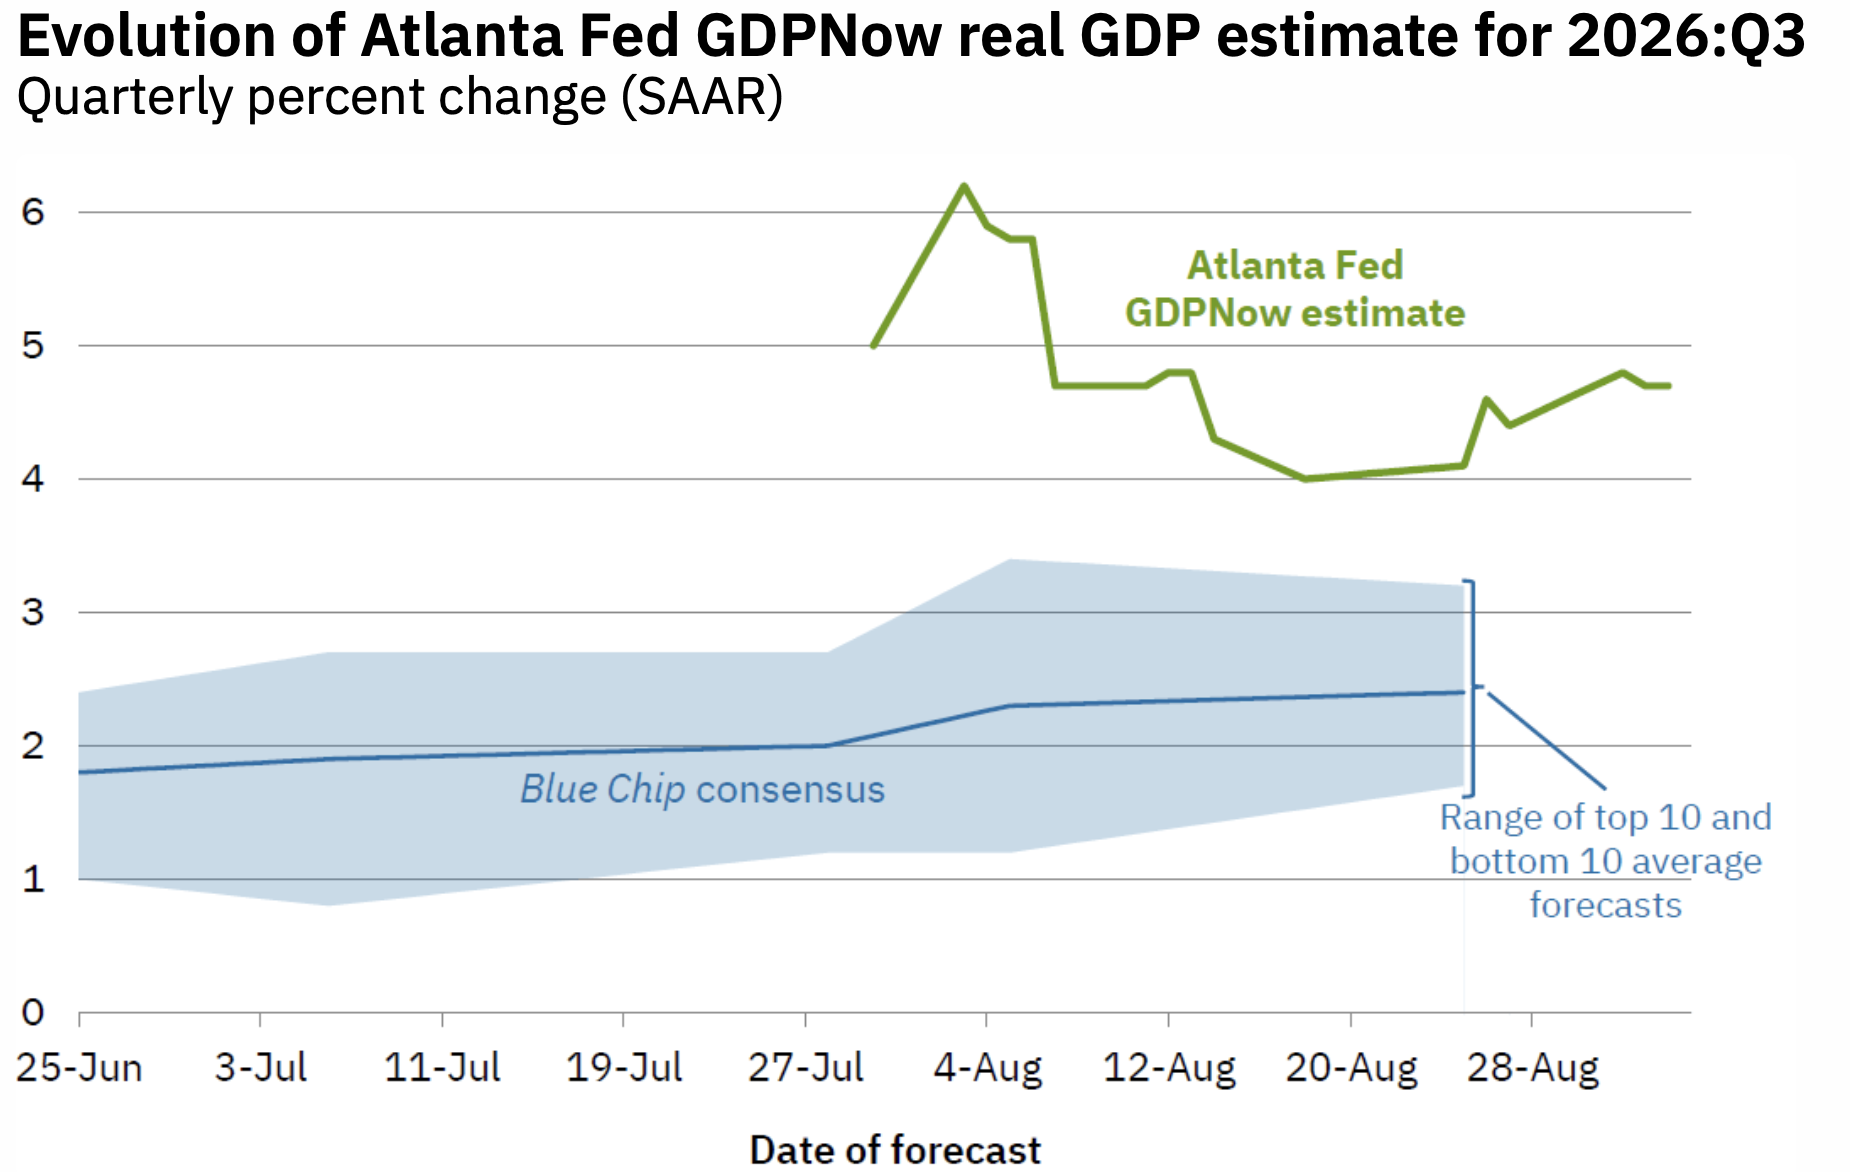
In the end, the idea that the economy is slowing has lost some of its mojo.  This is evident in the Atlanta Fed’s GDPNow Q3 estimate as per below, where it is now tracking to 4.7% real GDP growth.

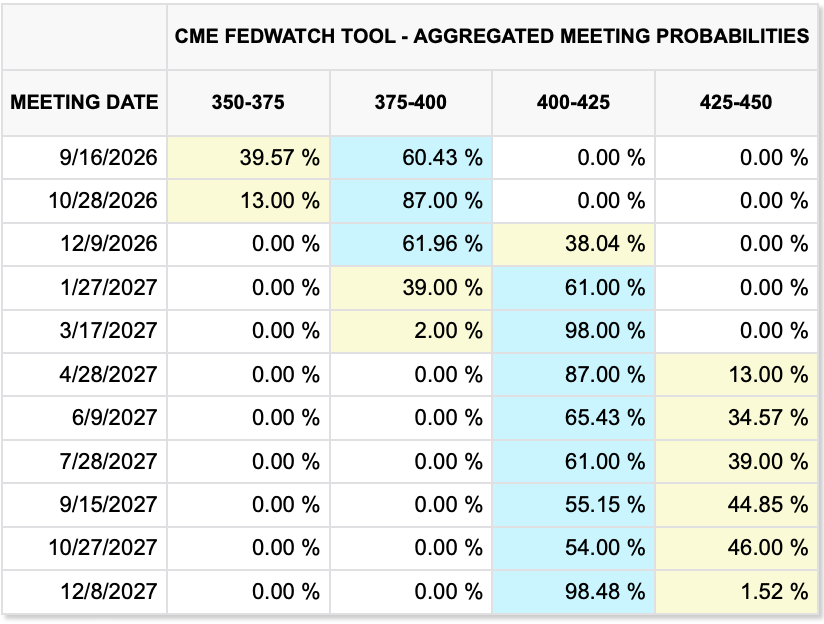
Similarly, the Fed funds futures market has rebounded to a 60% probability of a hike next week and another one by March of next year.

Personally, my take is that Chairman Warsh is ecstatic that the probability continues to hover either side of 50%.  As I have written consistently, uncertainty may result in short-term volatility, but it forces position reductions and less market fragility.  Remember, fragile markets are the ones that need to get bailed out.

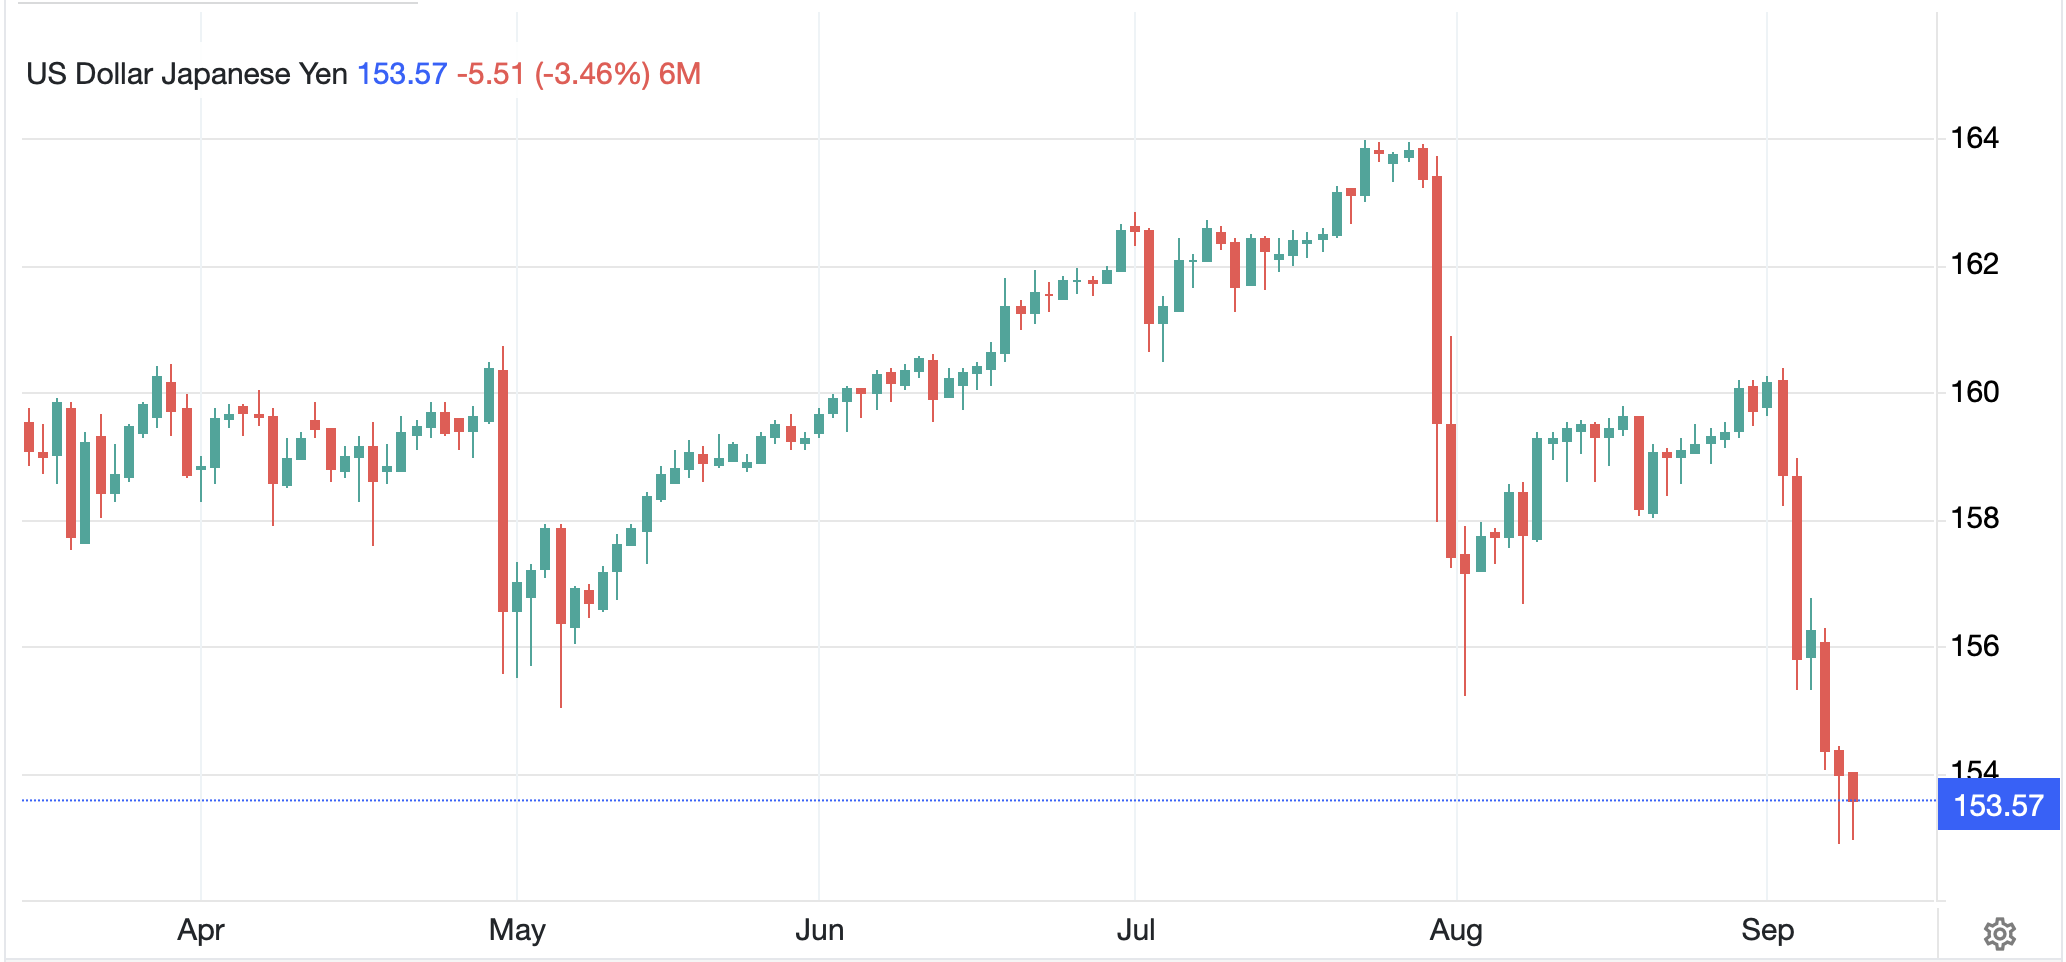
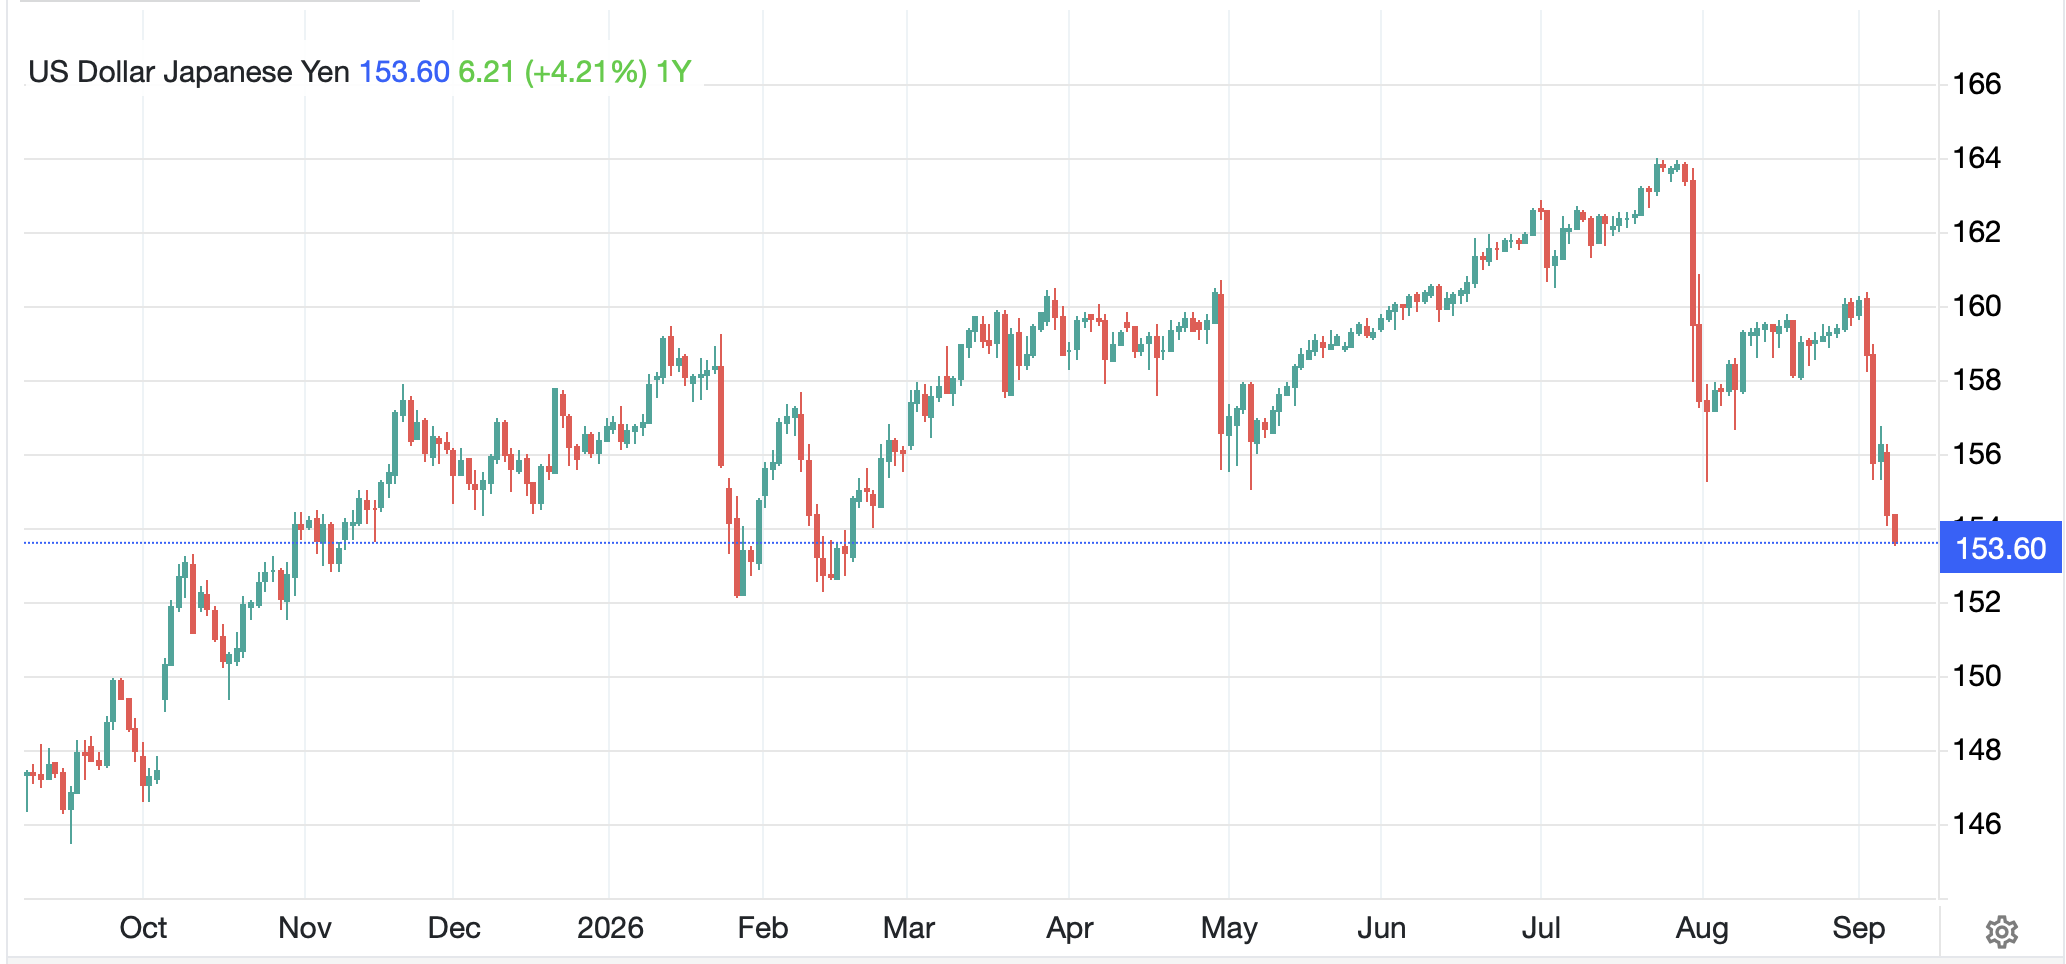
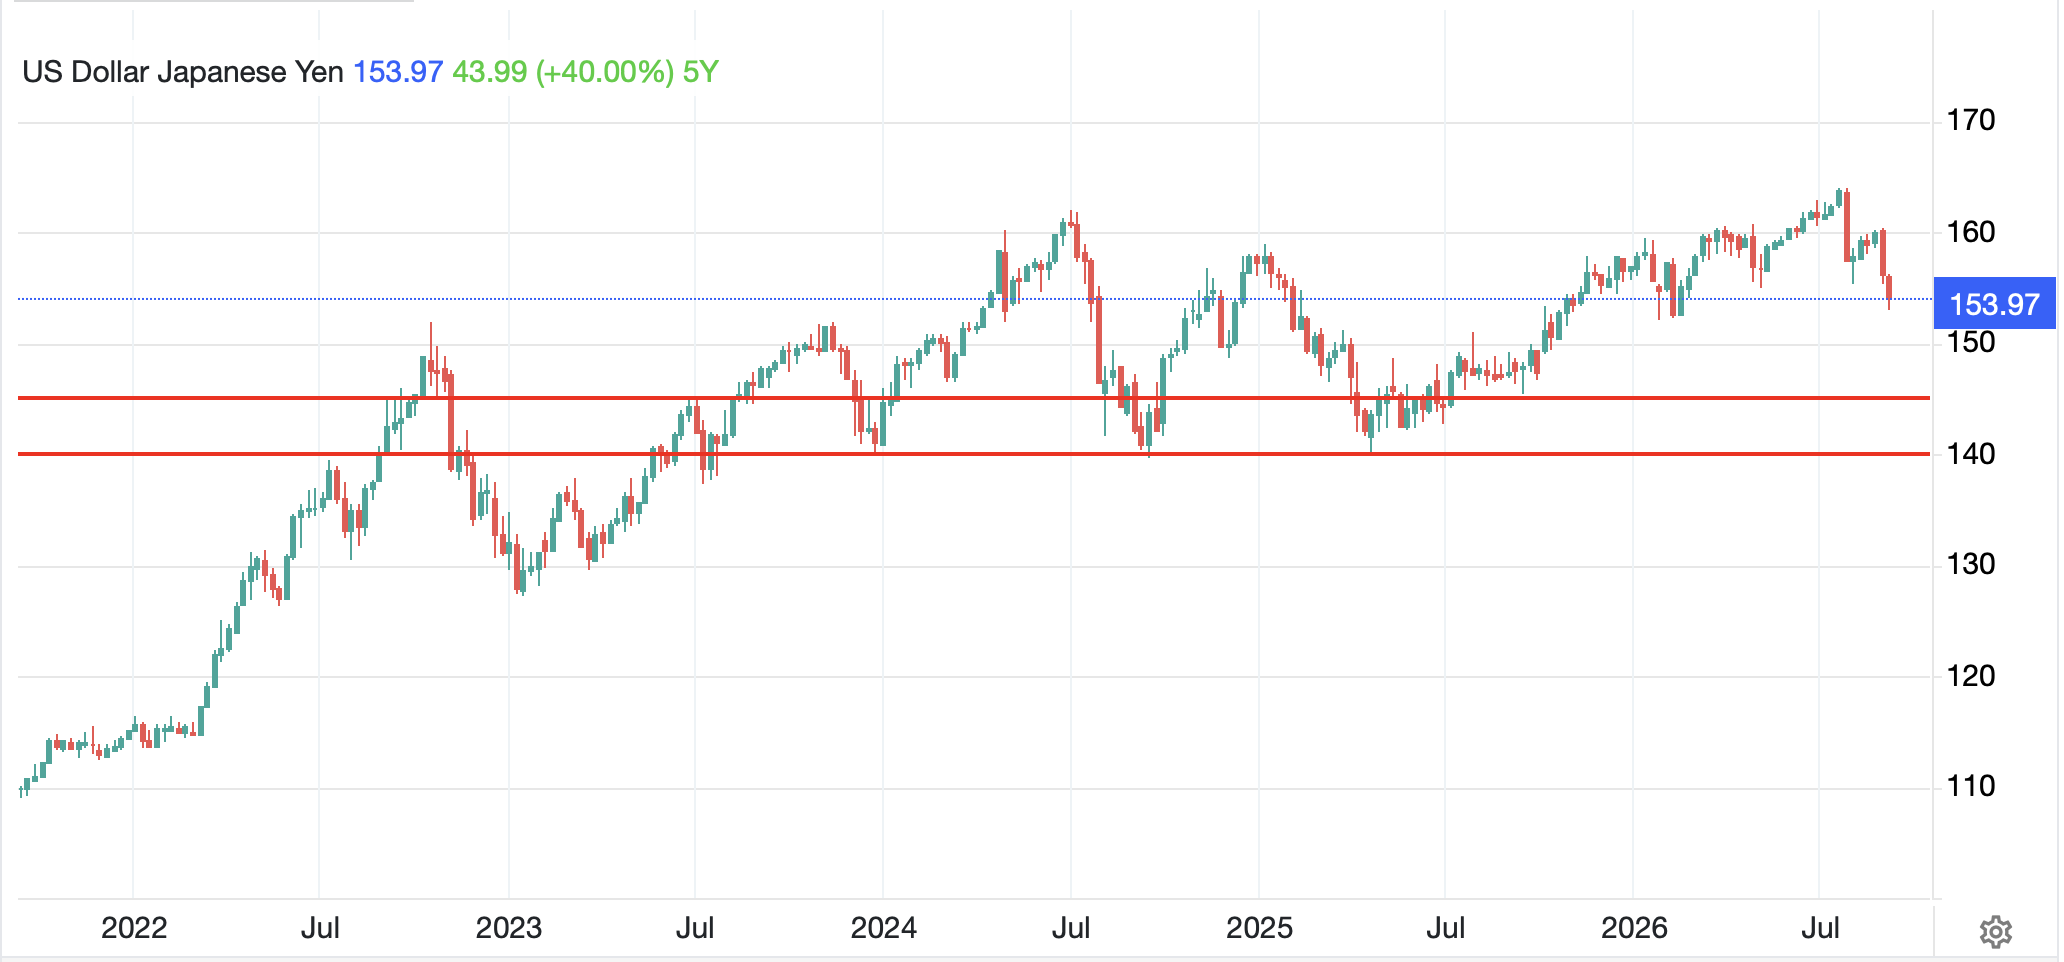
Under the guise of good news is bad, equity markets suffered a bit on Friday, with the major indices falling between -0.3% and -0.5%, not great, but seemingly not the beginning of the end.  Treasury yields did very little and the dollar slipped, but that was really all about the yen, which has been strengthening quite nicely over the past several sessions.  My thesis that the yen would continue to weaken is starting to look a little shaky as the dollar has now traded below its intervention lows and back to a level not seen since mid-February of this year as per the below chart from tradingecononomics.com.

While one hike is set
Is another coming soon?
And what of the Fed?

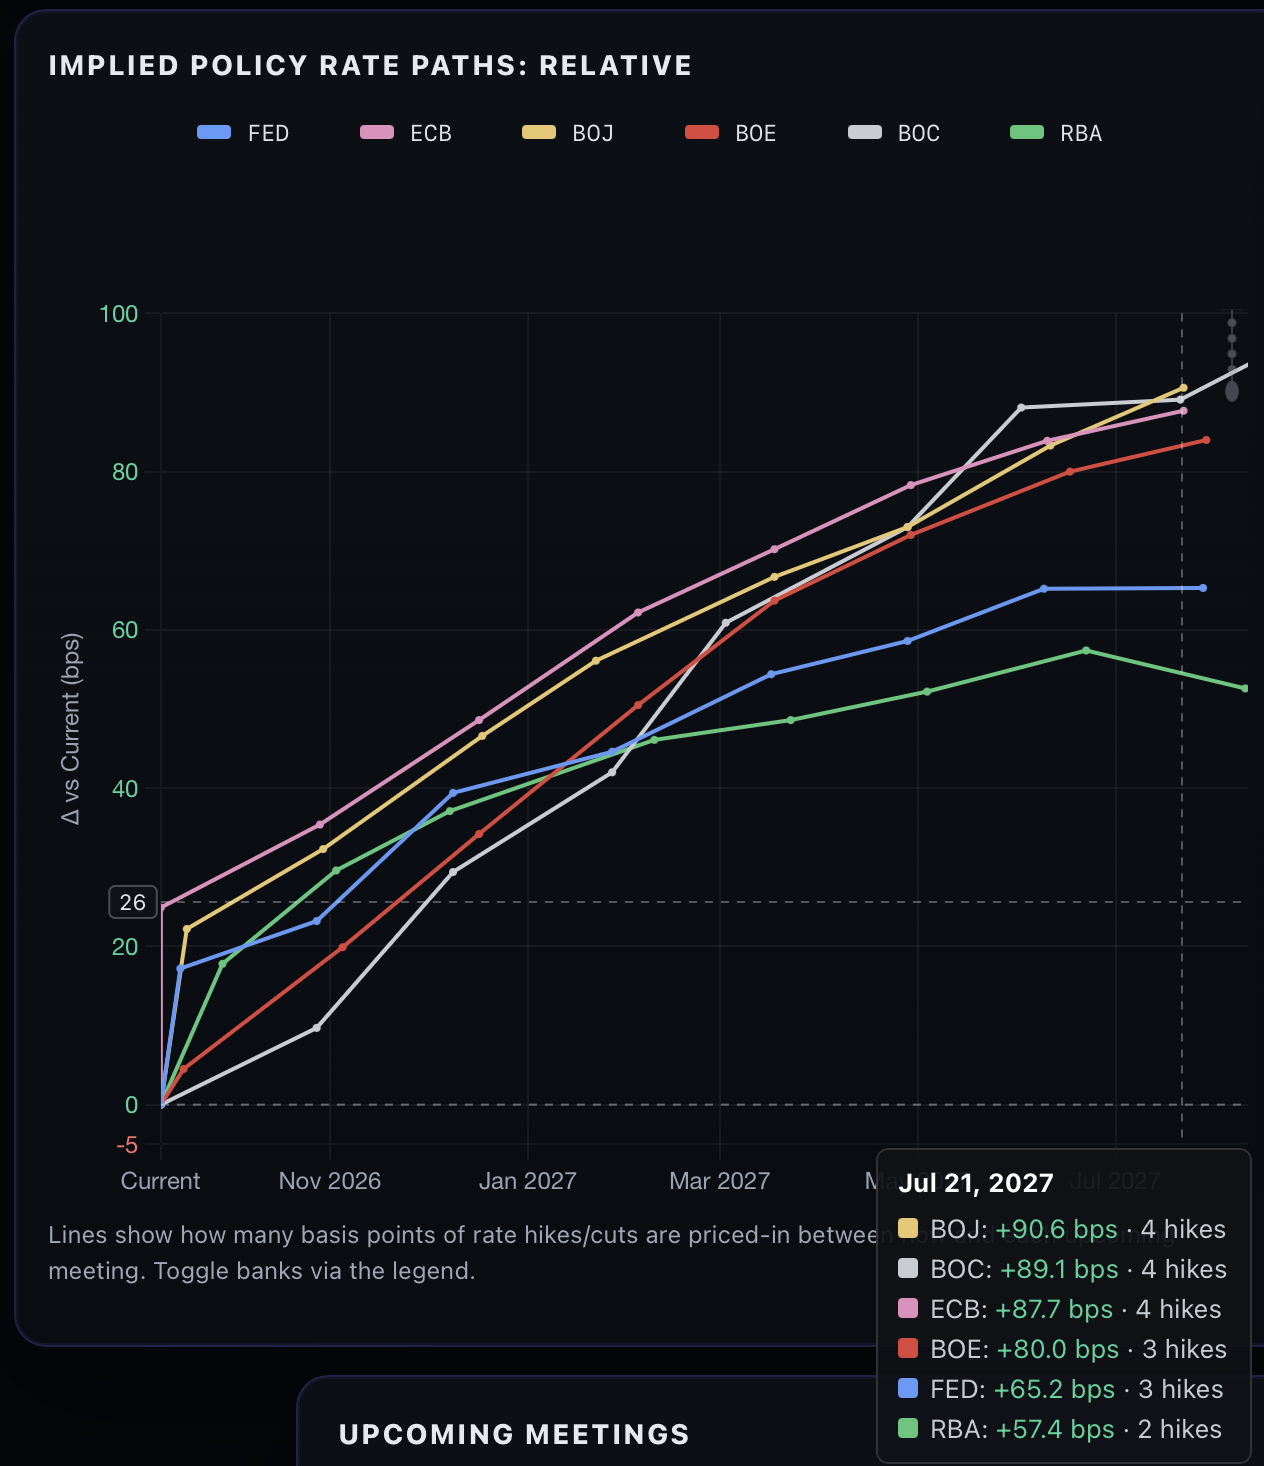
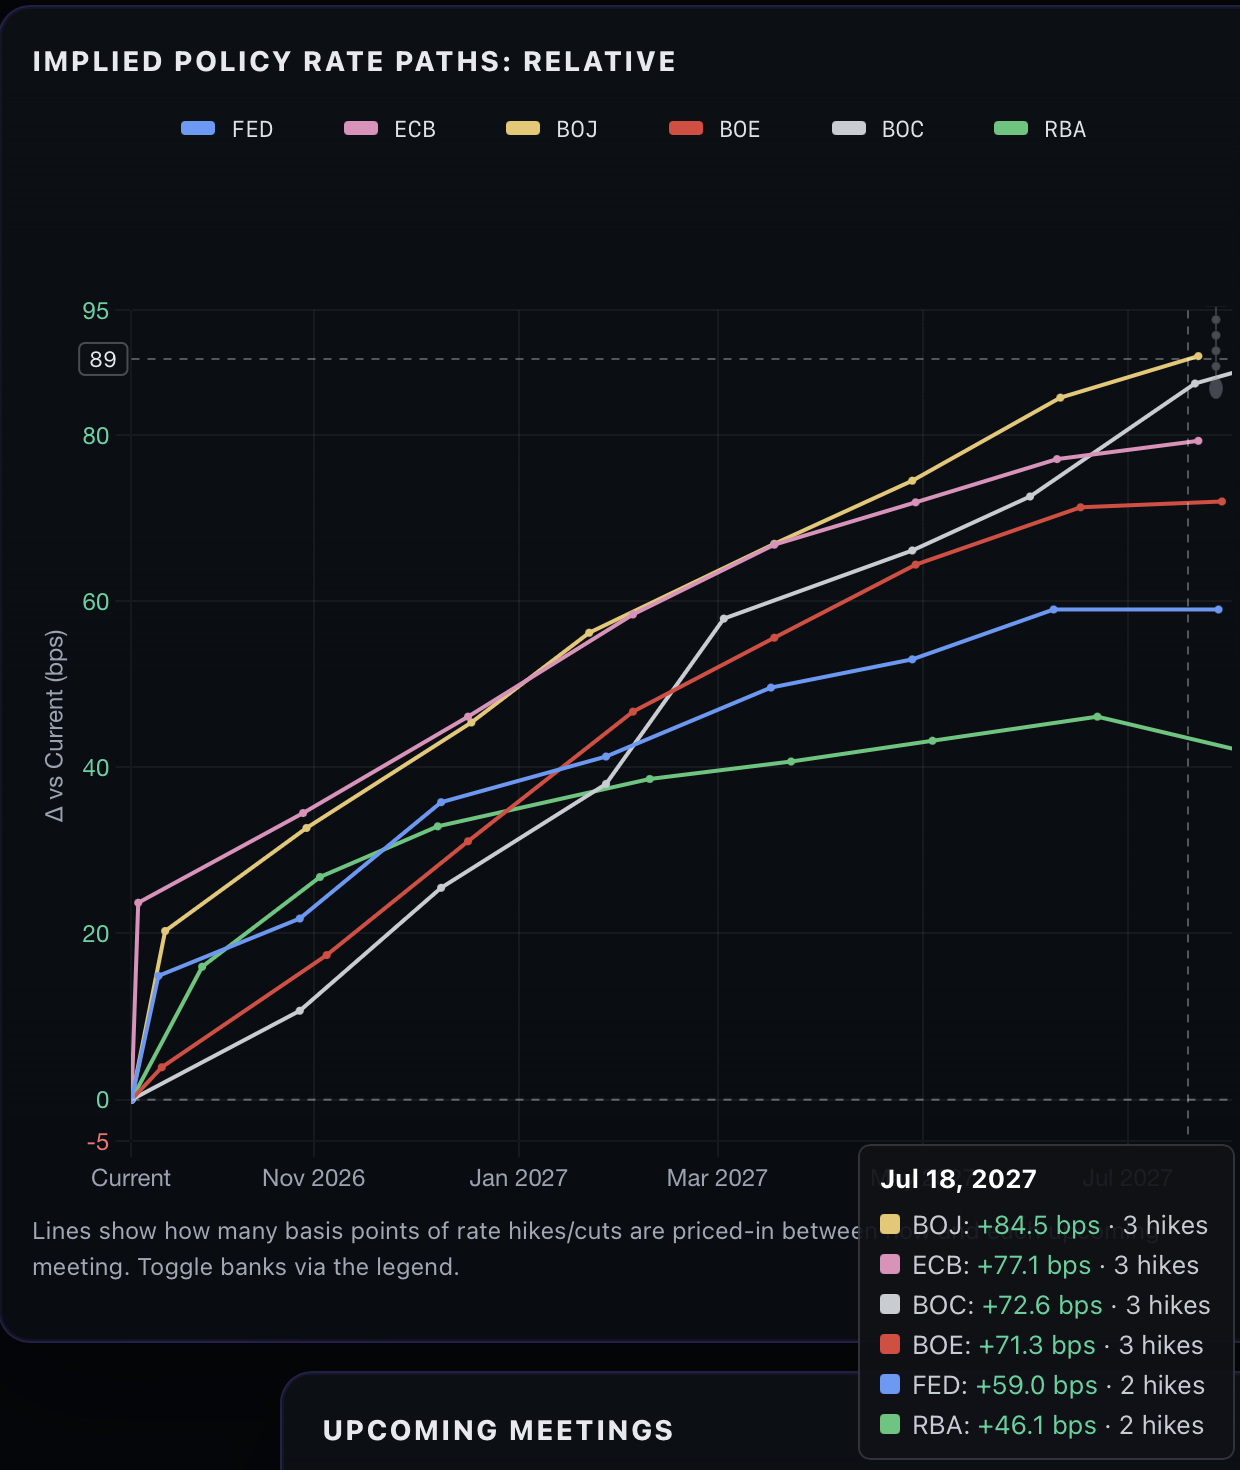
Which takes me to another question that has been difficult to answer; if both the BOJ and the Fed, as well as every other major central bank, raise rates this week and next, and are assumed to continue raising rates over the next year, as per the below chart from rateprobability.com, does that really change the relative situation and should FX rates move substantially on the news?  

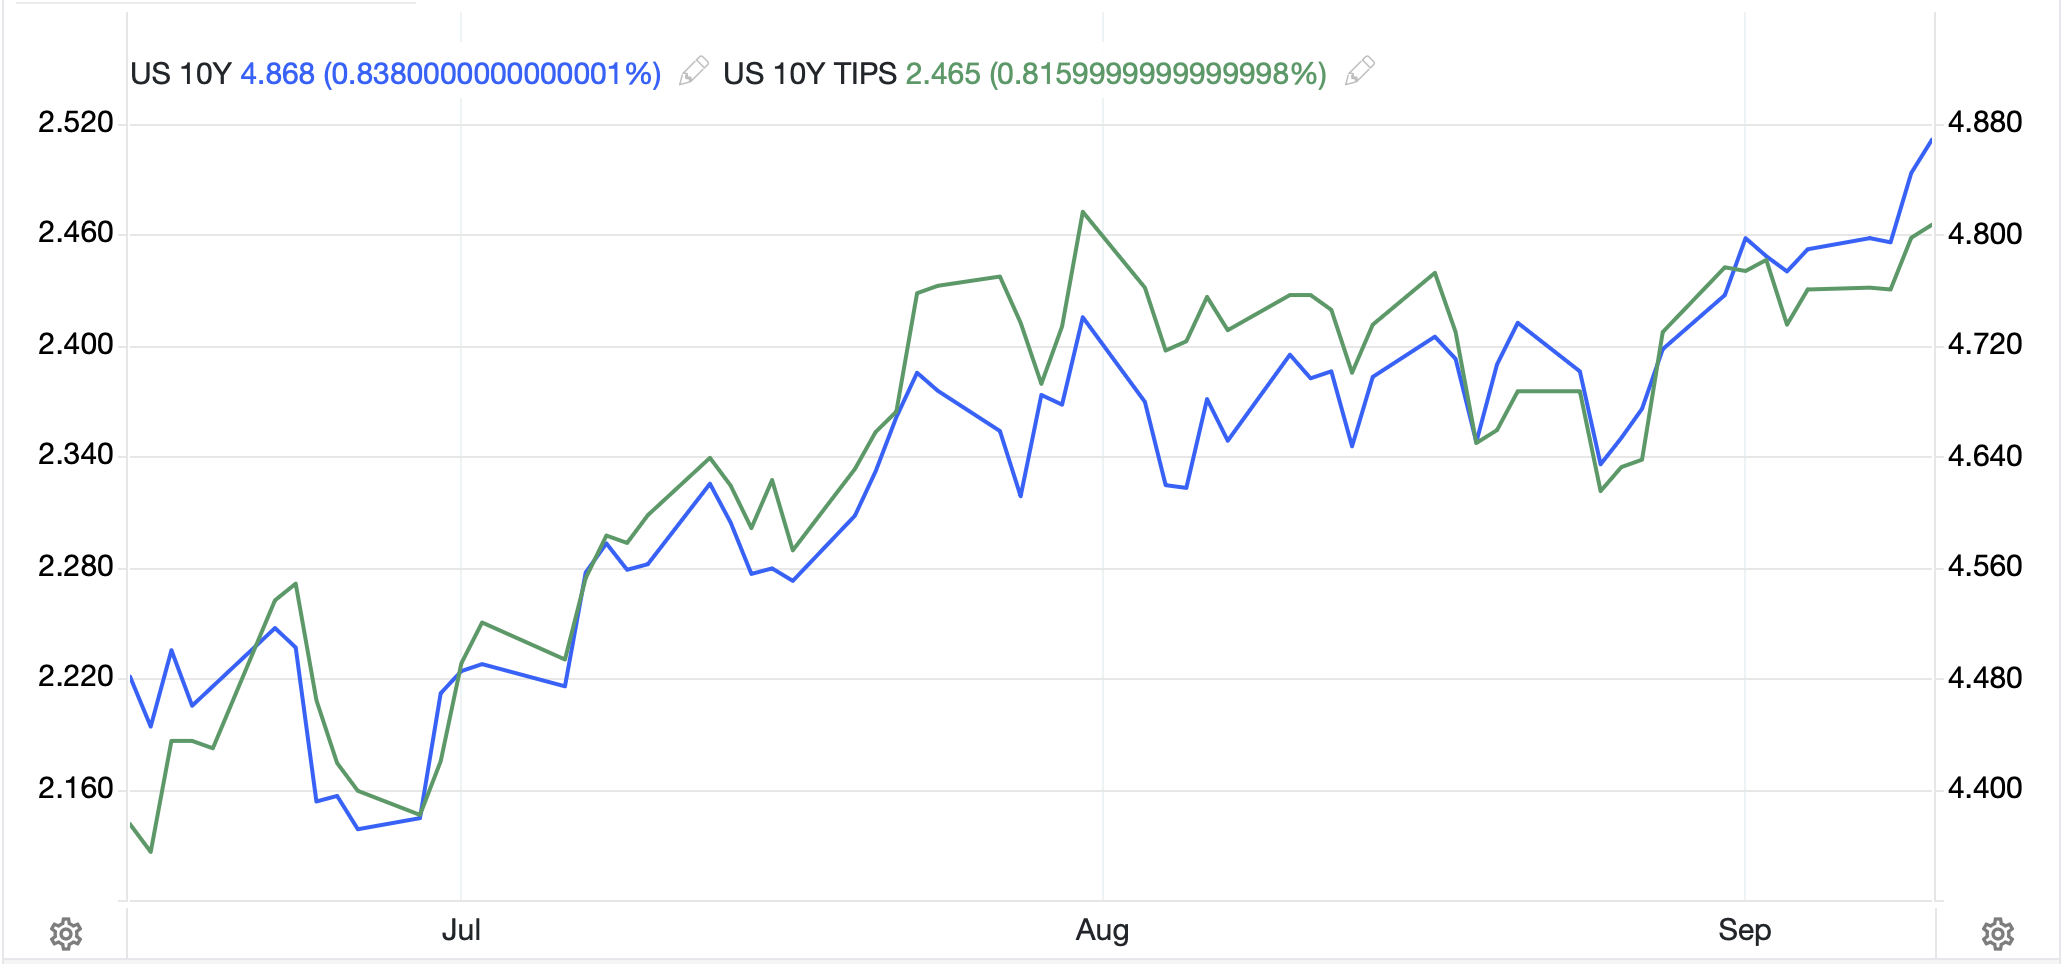
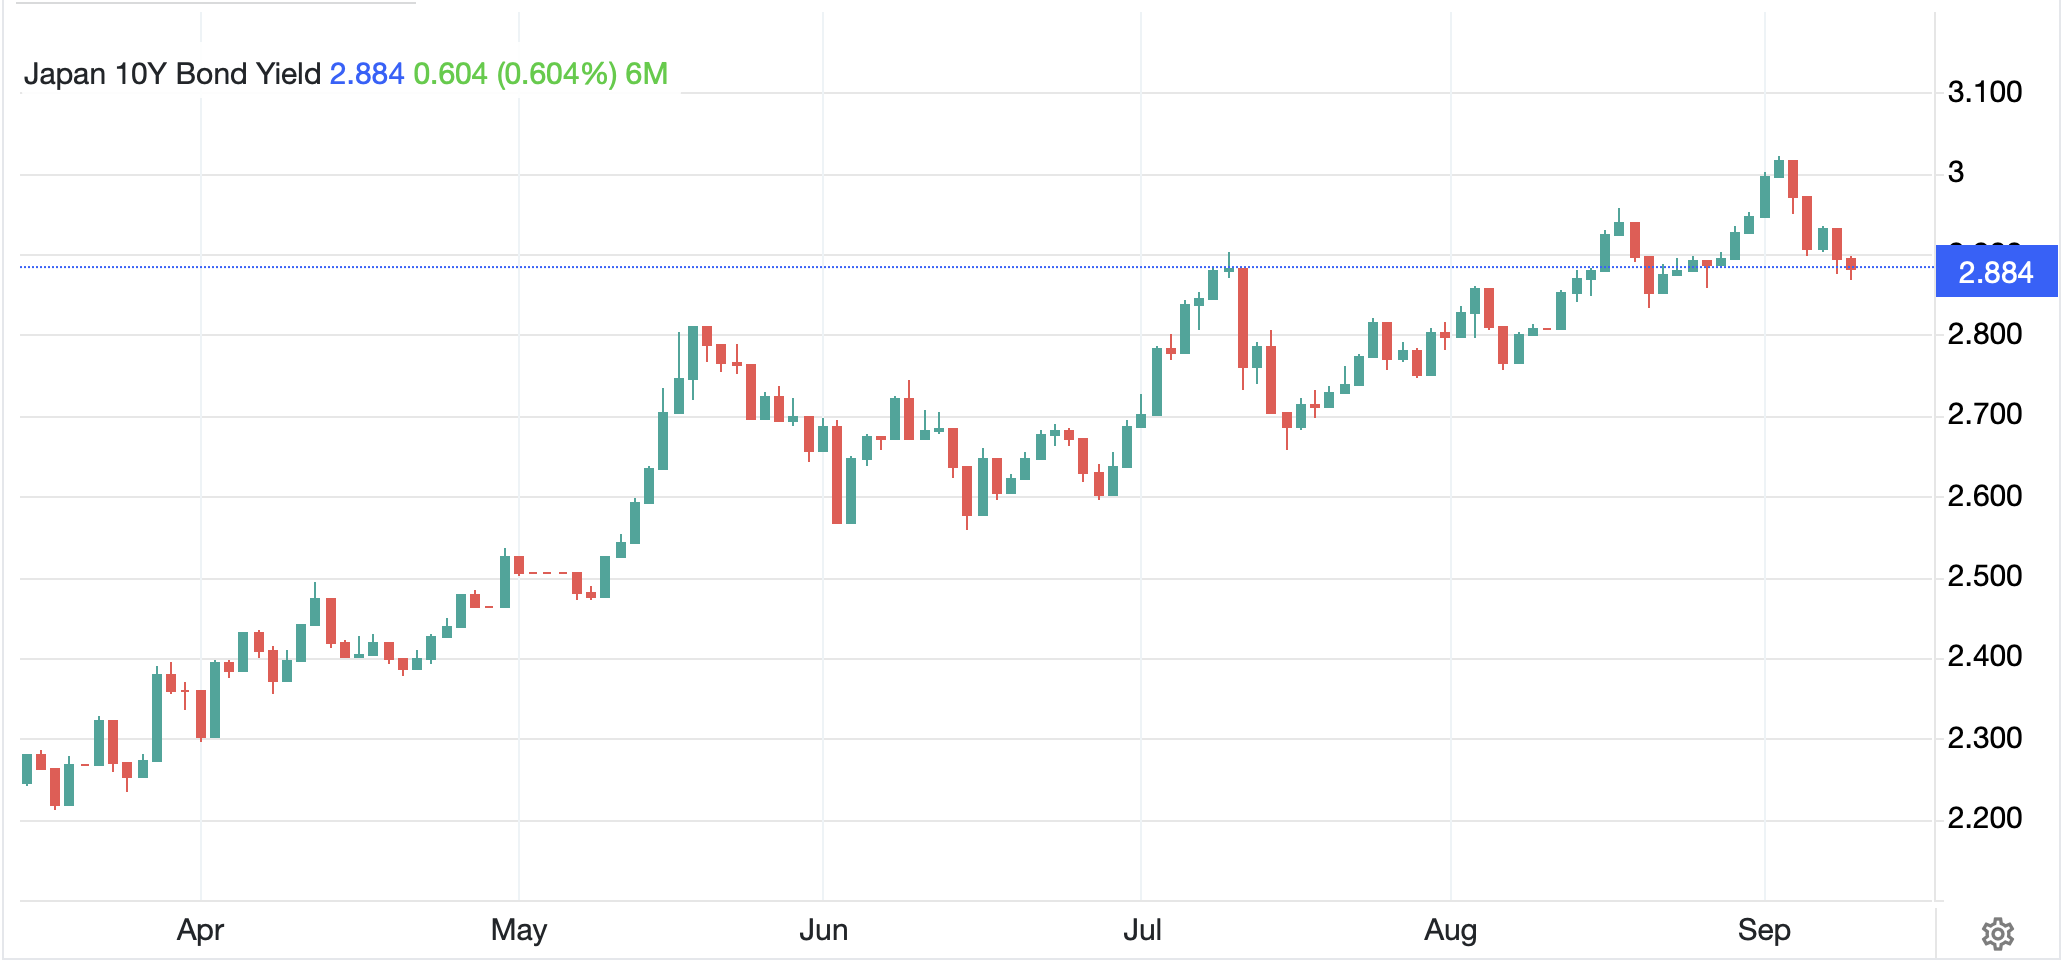
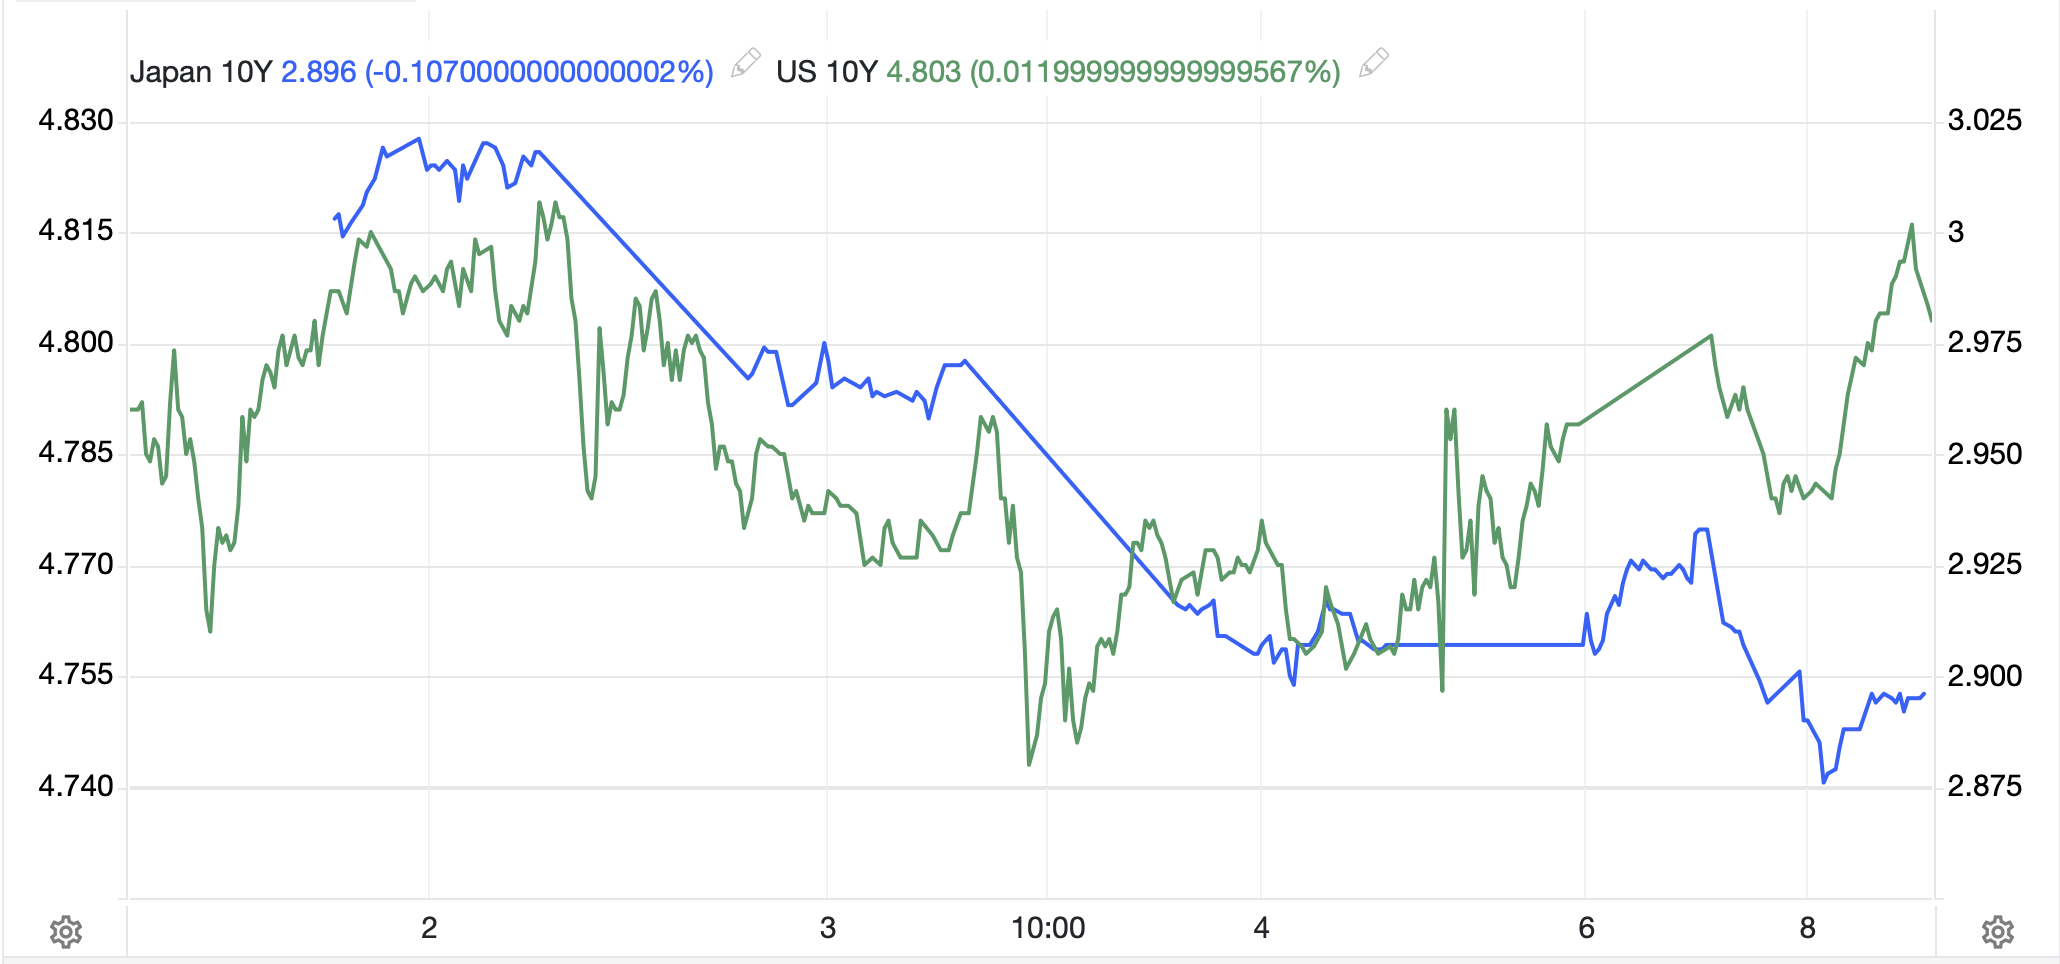
According to the chart, the BOJ is going to hike by 25bps more than the Fed over the next year.  Is that really worth 10 big figures in spot USDJPY?  More?  Less?  The interesting thing about the weekend is that Japanese 10-year yields slipped -2bps and appear to have broken free, at least temporarily, from the gravity of Treasury yields as the latter continue to edge higher, rising 2bps since Friday as per the below chart.  (Europe was basically unchanged.)

Source: tradingeconomics.com

As I weigh the evidence, it appears that the market is pushing to find the fail-safe point for carry traders, as well as Japanese investors writ large, and where interest rate differentials, as well as outright rates, need to be to alter decades worth of behavior.  Perhaps it is not the yield differentials that are driving the FX rate but the other way around.  If USDJPY falls far enough, that could well be the catalyst for a major change in the relative yield structure between dollars and yen.  Bessent certainly has a delicate task ahead of him.  On an unscientific basis, but rather one that is simply my feeling from experience, and looking at the yen chart for the past five years, I would suggest that while 150 is the next big round number, we are likely to head to somewhere between 140 and 145 as the new home, a place where the yen has strengthened sufficiently to impact trade, but not so far as to result in massive Treasury sales.  We shall see.

Source: tradingeconomics.com

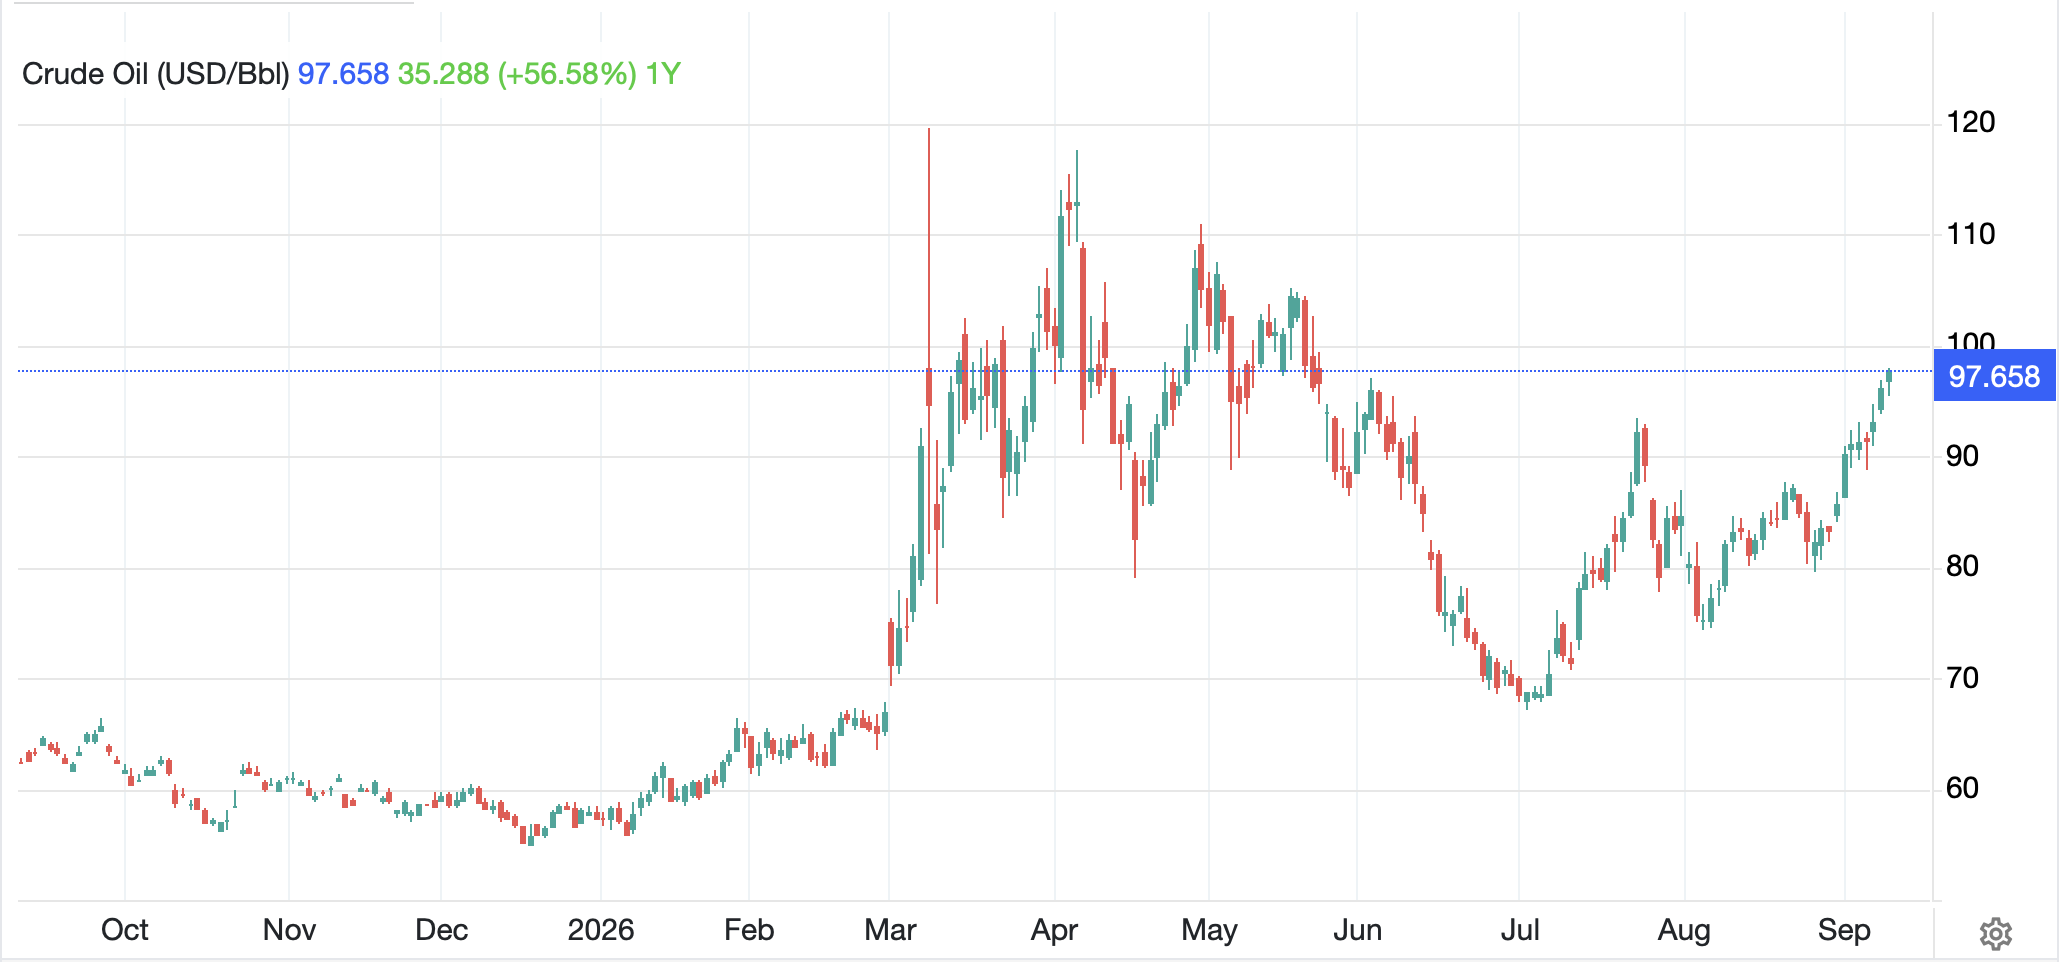
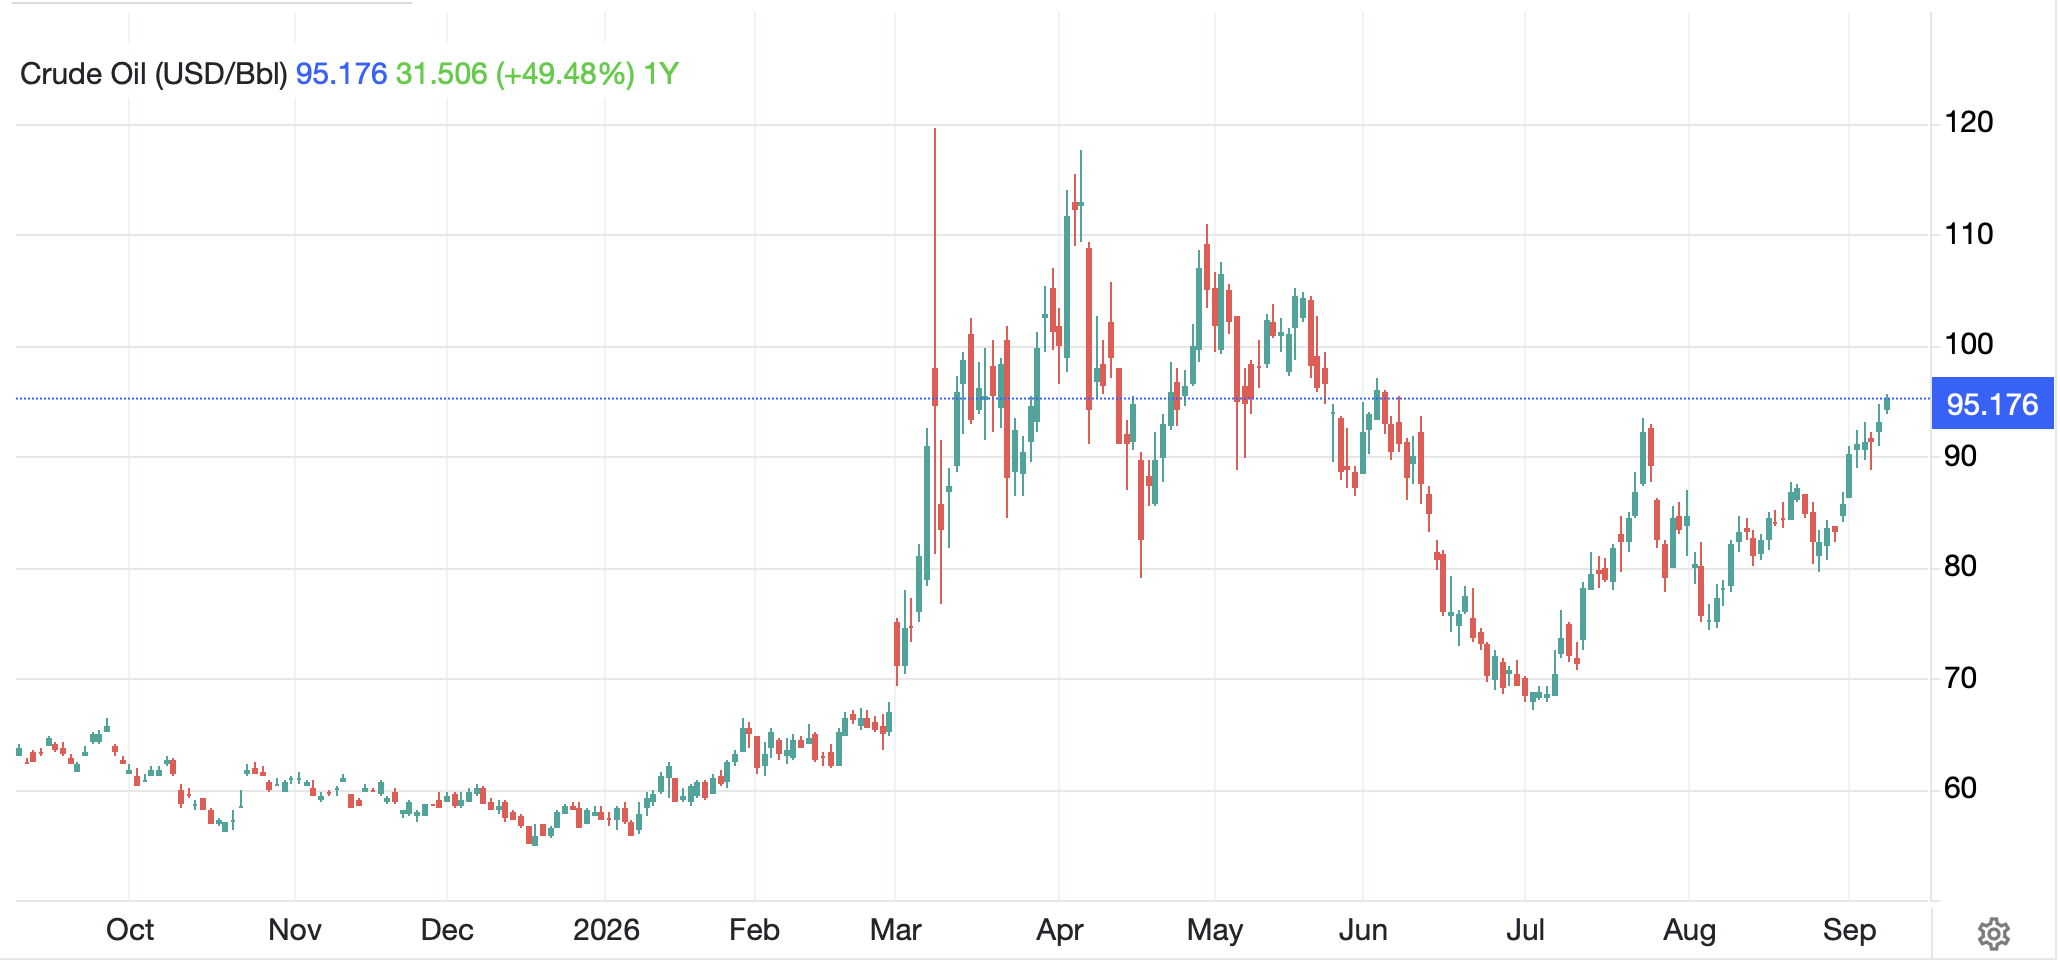
Turning away from the eccentricities of the yen, oil prices are rising again, up another 2.7% this morning and now well above $90/bbl.  This is, not surprisingly, dragging both gasoline and diesel prices along for the ride, a situation that I’m sure has the White House plotting.  But the Houthis have attacked Saudi oil infrastructure and the ongoing tit-for-tat in the Gulf and the Strait continues.  The WSJ had a headline story about the US naval blockade really starting to bite there as oil revenues dry up.  This has certainly been effective, although it is taking longer than, I’m sure, the administration had wanted.  Elsewhere in the commodity space, while gold and silver are little changed to slightly lower this morning, copper (+2.0%) has continued to rally and has reached new all-time highs on both the LME and the COMEX.  This continues to be a story of insufficient supply for requisite demand, and demand continues to grow as data centers keep mushrooming up.  But copper mines take a decade or more to find, permit and bring online, and there haven’t been any in the works for years.  I think this is a market that despite being at record highs has room to run.

Equity markets have also been under pressure as the combination of anticipated rate hikes, increased war concerns and higher energy prices has weighed on markets writ large.  Obviously, oil companies and mining companies are benefitting from the price movement, although higher interest rates are a drag, but elsewhere, things are tougher.  So, looking across Asia, red was the color of the day (Japan -1.7%, China -0.4%, HK -0.4%, Korea -0.6%, India -0.7%, Taiwan -0.5%, Australia -1.0%).  In Europe, the picture is not quite as grim, with the declines smaller (Germany -0.2%, France -0.1%, Spain -0.3%) but declines they are.  As to US futures, at this hour (6:55), -0.6% seems to describe the situation.  Of them all, I think the yen’s strength has been the driver for Nikkei under performance.

Finally, the FX markets, away from the yen show modest dollar strength.  The euro (-0.1%), pound (-0.1%), CHF (-0.3%), AUD (-0.1%) are all slightly softer as trading desks get back to full strength now that the summer has unofficially ended.  While yen is the major topic of conversation, it is no surprise to see CLP (+03%) rally alongside copper and KRW (+0.2%) continues its several month appreciation, which has now reached 16% since July 1st.  Otherwise, it is not too exciting on this front this morning either. 

As I mentioned above, we have PPI, CPI and the first of the multiple central bank meetings this month, the ECB, on Thursday.

TodayConsumer Credit$11.7B
ThursdayECB rate decision2.50% (current 2.25%)
 Initial Claims205K
 Continuing Claims1790K
 PPI0.4% (5.3% Y/Y)
 Core PPI0.3% (4.6% Y/Y)
 Existing Home Sales3.99M
FridayCPI0.4% (3.4% Y/Y)
 Core CPI0.2% (2.4% Y/Y)
 Michigan Sentiment51.0

Source: tradingeconomics.com

Obviously, all eyes will be on the CPI data but as things heat up in the gulf, I suspect we can look for movement catalysts there as well.  In the meantime, the yen will be of great interest to one and all, whether traders, investors or Treasury Secretaries.  If we see this strength continue, look for more discussion and other market movement.  I don’t foresee a collapse in the dollar, but rather a steady reversal of what has been a steady trend higher in the dollar, lower in the yen.

Good luck

Adf

Rumors Imply

Did the BOJ
Intervene? Rumors imply
Lifers it the bid

Twenty-five? Fifty?
Do they really want yen strength?
Can they live with that?

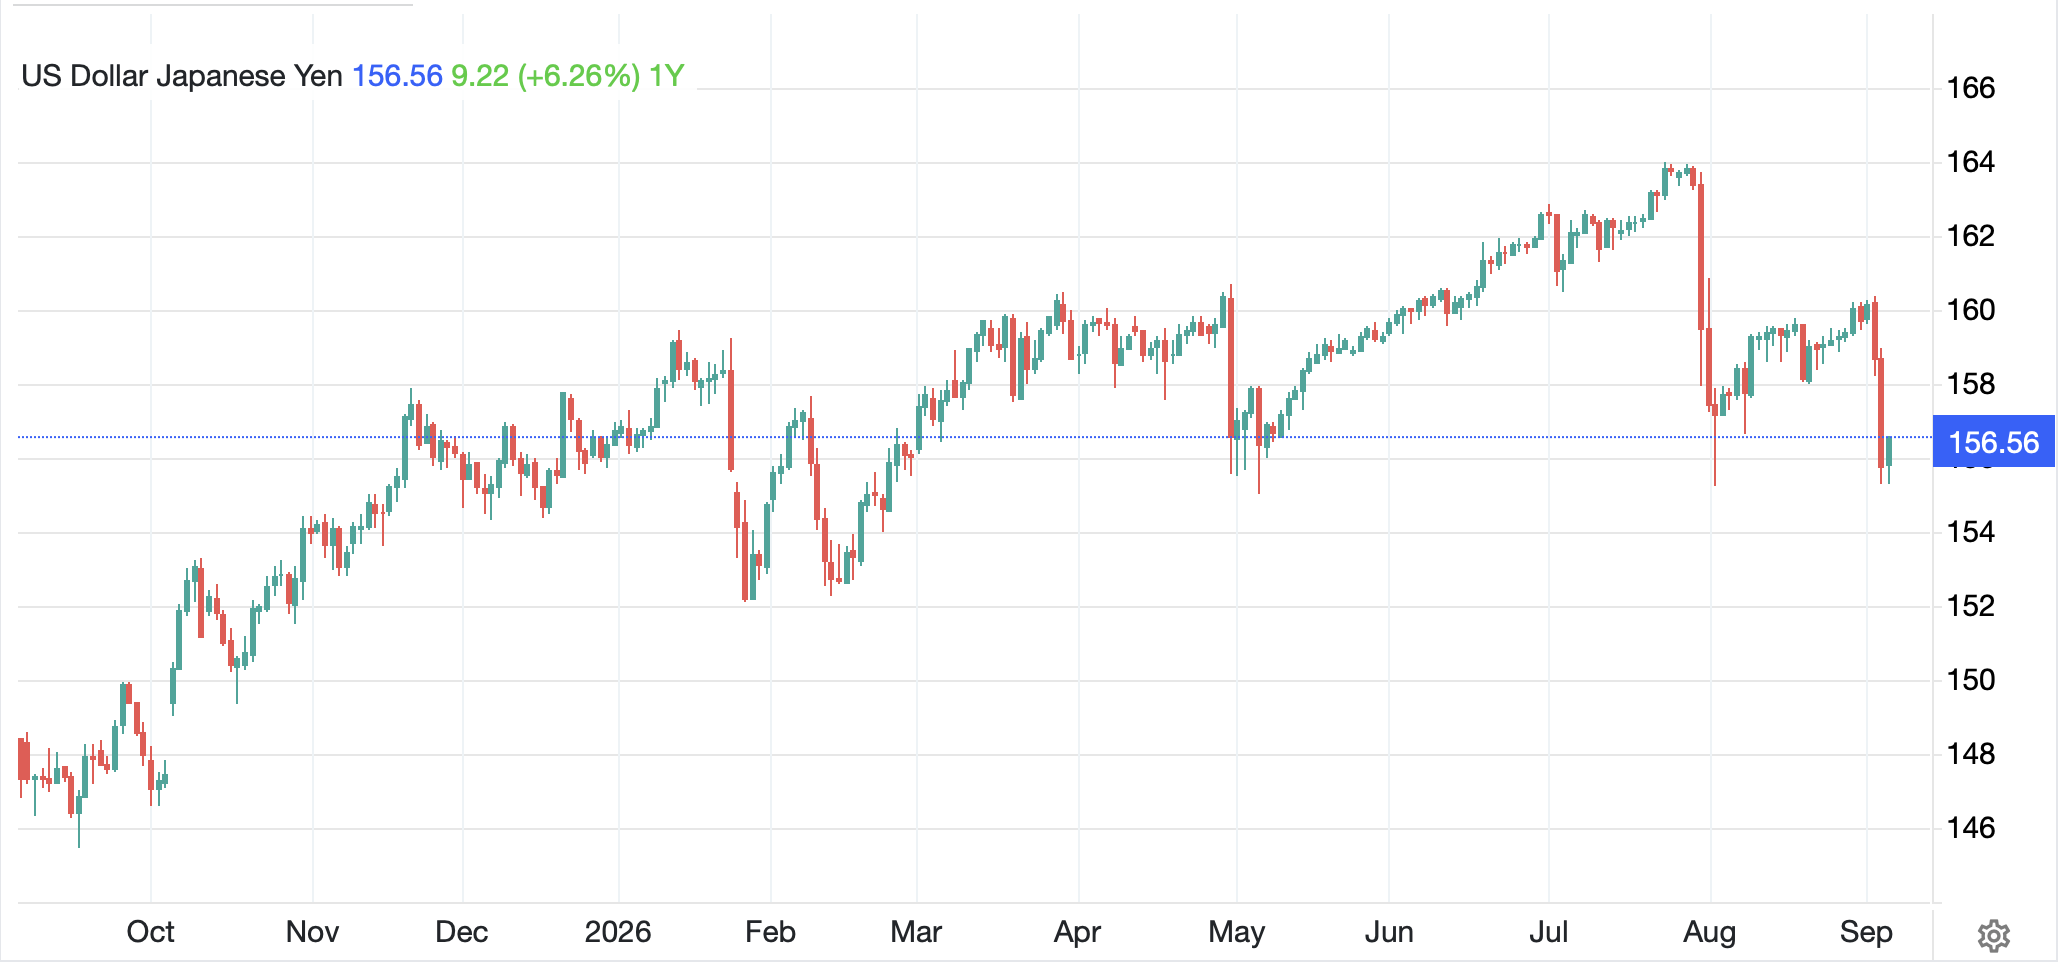
When looking at charts, as I frequently indicate, the timeline of the chart matters a great deal.  For instance, if we look at this 1-year chart with daily candles of USDJPY after the yen jumped 1.8% yesterday, it would be easy to conclude there was another bout of intervention.  After all, the price action certainly seems to indicate a virtual gap move lower, just like the other interventions that we have seen during the past year.

Source: tradingeconomics.com

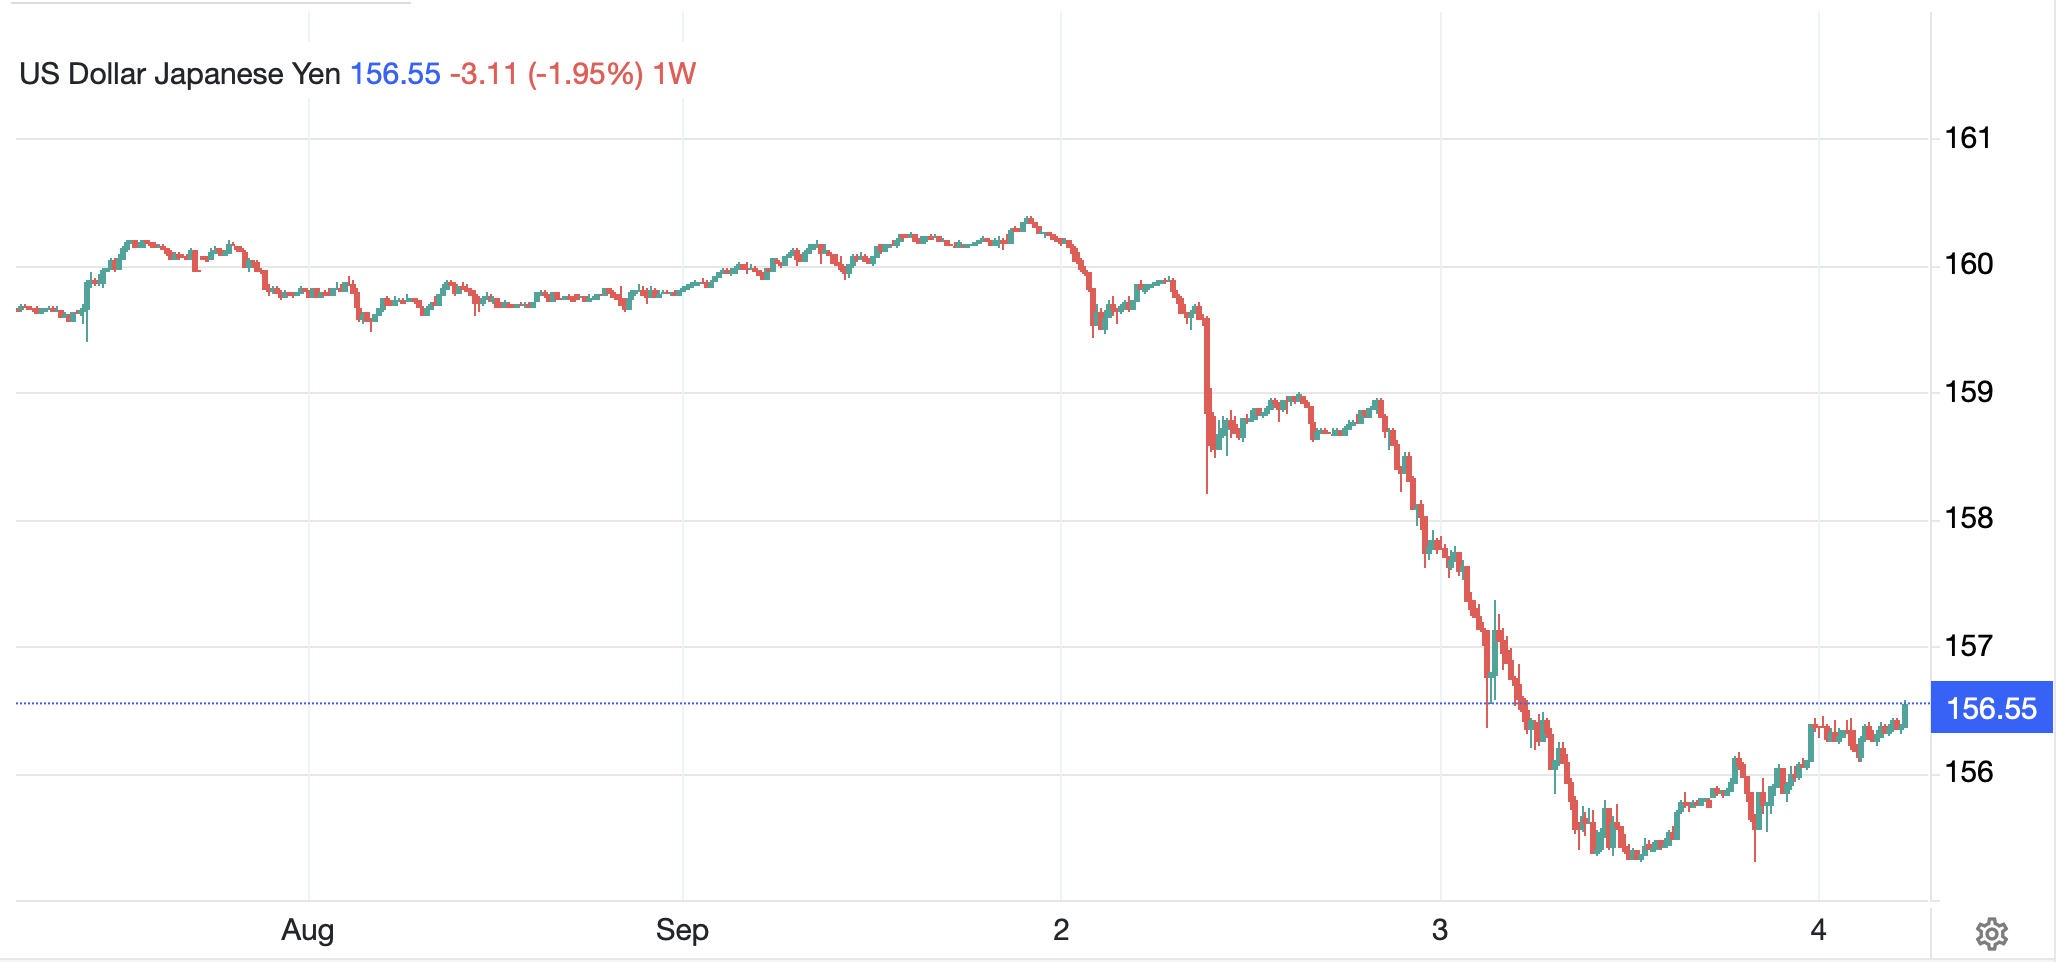
However, if we look at the chart with much shorter time increments, for instance 15-minute candles, we see that while there was significant selling pressure all day yesterday, and actually from the night before, there are really no gaps on the way down.  This is indicative of a large sell order that is relatively price insensitive meeting a market that is on edge, but absent a clearer signal of intervention, a market that is still willing to make prices.

Source: tradingeconomics.com

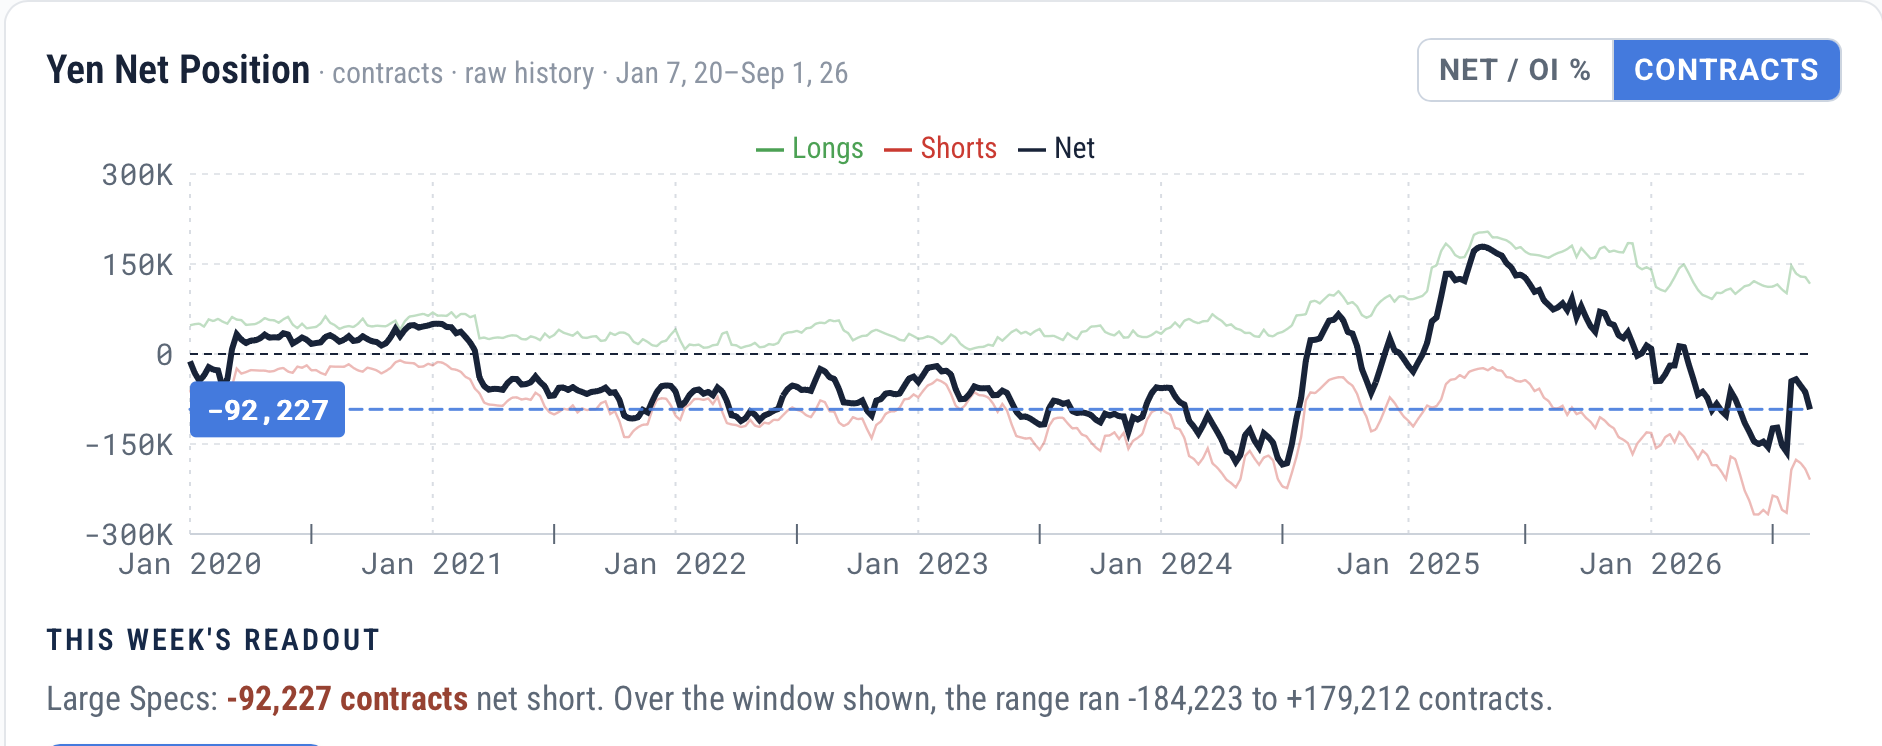
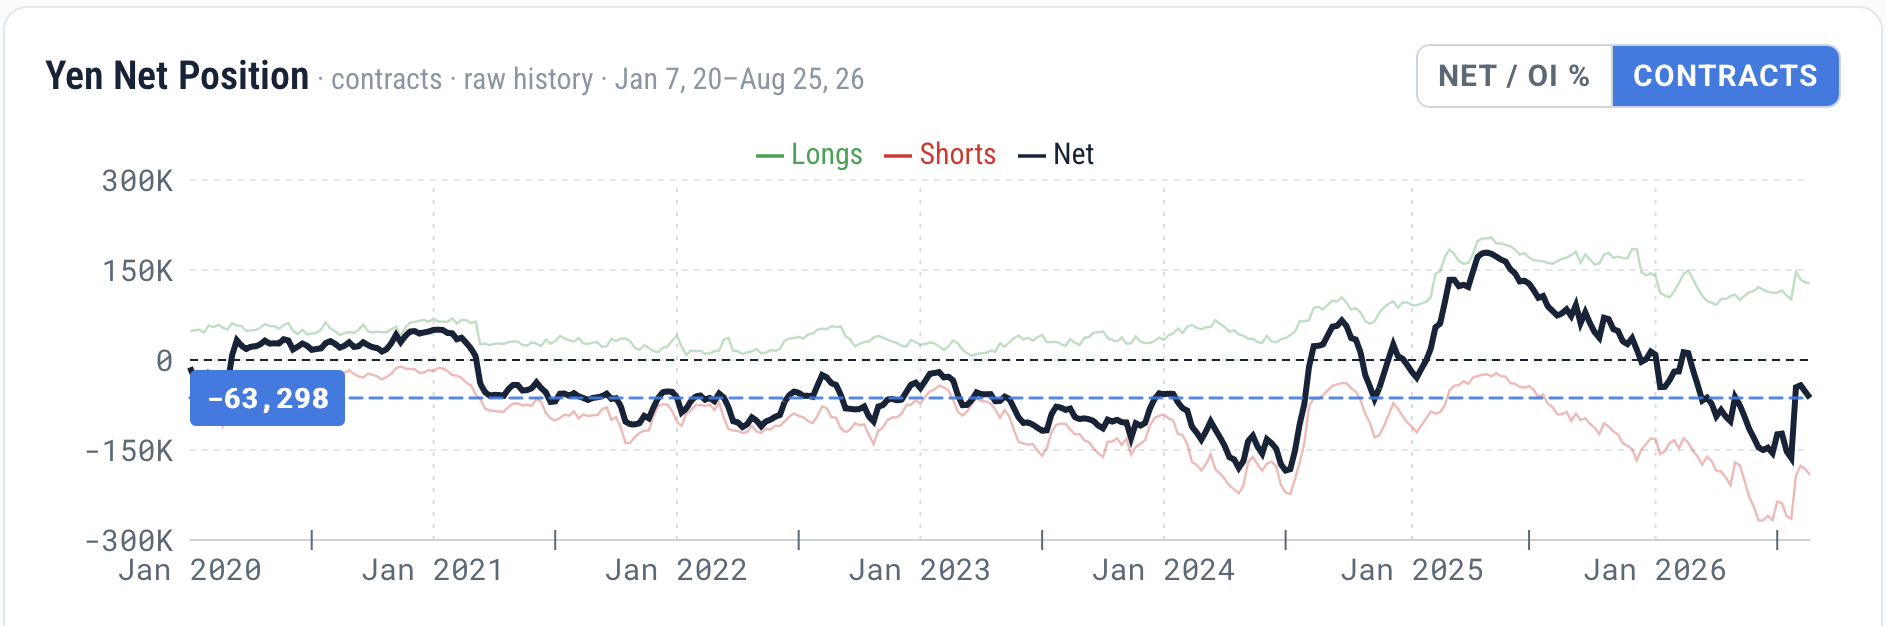
As it happens, from what I understand the market rumor was that the GPIF was moving funds out of dollars, something that had been mooted several weeks ago after Japanese FinMin Katayama discussed it in a news conference, but there was no sign of the BOJ.  And, of course, this morning JPY (-0.5%), has reversed some of that move.  Remember, the BOJ meets in two weeks’ time and as I mentioned on Wednesday, while a 25bp rate hike seems to be baked in the cake, there is increasing talk of 50bps.  Right now, the market is not pricing 50bps, in fact they are at 21bps, so not quite a full hike.  If Ueda-san really wants the yen to strengthen, 50bps will do the trick as it would really hurt the massive JPY shorts that are still rampant.  (see below chart from cotsignal.com). 

Now, over the past month, that net short position, at least in the futures markets, has been reduced, but there are still many short positions in various forms OTC.  A 50bp hike would definitely hurt them and a move to, and possibly through, 150 would be viable then.

Of course, none of that even considers things like this morning’s NFP or next week’s CPI.  There is still plenty of fun to be had!

The other big story today
Is whether a rate hike's in play
If NFP's strong
One could come along
If weak, there will be a delay

Which takes us to the NFP release this morning.  here are the current median estimates by the economist community

Nonfarm Payrolls56K
Private Payrolls45K
Manufacturing Payrolls5K
Unemployment Rate4.1%
Average Hourly Earnings0.3% (3.0% Y/Y)
Average Weekly Hours34.3
Participation Rate61.4%

Source: tradingeconomics.com

Now, ADP Employment was slightly weaker than expected on Wednesday at 38K, but again, this begs the question of how many jobs are necessary in the US economy to continue to maintain full employment and economic growth.  Remember, too, last month’s NFP was surprisingly weak at -23K.  If we were to see another zero to negative outcome, the Fed funds futures market would completely reverse its recent hawkishness, which moved from a ~35% probability of a hike before the Warsh Jackson Hole Speech to a ~65% probability afterwards, but has since drifted back to basically 50:50 after hearing Fed Governor Waller indicate he is a hold as long as data keeps pointing toward declining inflation.  Any weakness today, and especially in next Friday’s CPI reading will likely reverse that period of hawkishness.

At this point, a hike is still fully priced in by the end of this year, although if they hold now, it would be a surprise to see a move one week before the midterm elections.  Arguably, the biggest problem regarding inflation in the US right now is diesel fuel, which as you can see in the below chart has more than doubled in price since December.

Source: barchart.com

Diesel filters into the prices of virtually all goods as transportation for delivery costs rise, and the one thing we all know is that once a company raises prices because of a fuel surcharge, that surcharge never goes away, it is simply absorbed into the price at some point in the future.  In fact, this may well be the single most concerning issue regarding future inflation, at least until the military action in both Iran and Ukraine/Russia ends.  Of course, the Fed cannot print diesel, but do they really want to go down the route of demand destruction?  That is a tough call.  I guess we shall all learn more in two weeks’ time as the quiet period is beginning today.

Which takes us to market activity.  Yesterday’s strong US equity performance was followed by a mixed picture in Asia, although there was far more strength (Tokyo +1.3%, HK +1.7%, Korea +1.6%, India +0.5%, Taiwan +1.5%) than weakness (China -0.1%, Australia -0.2%, Malaysia -0.4%, Indonesia -0.5%) with the rest of the bloc stronger rather than weaker.  In Europe, though, markets are essentially unchanged this morning ahead of the NFP number and US futures are also little changed at this hour (6:55).

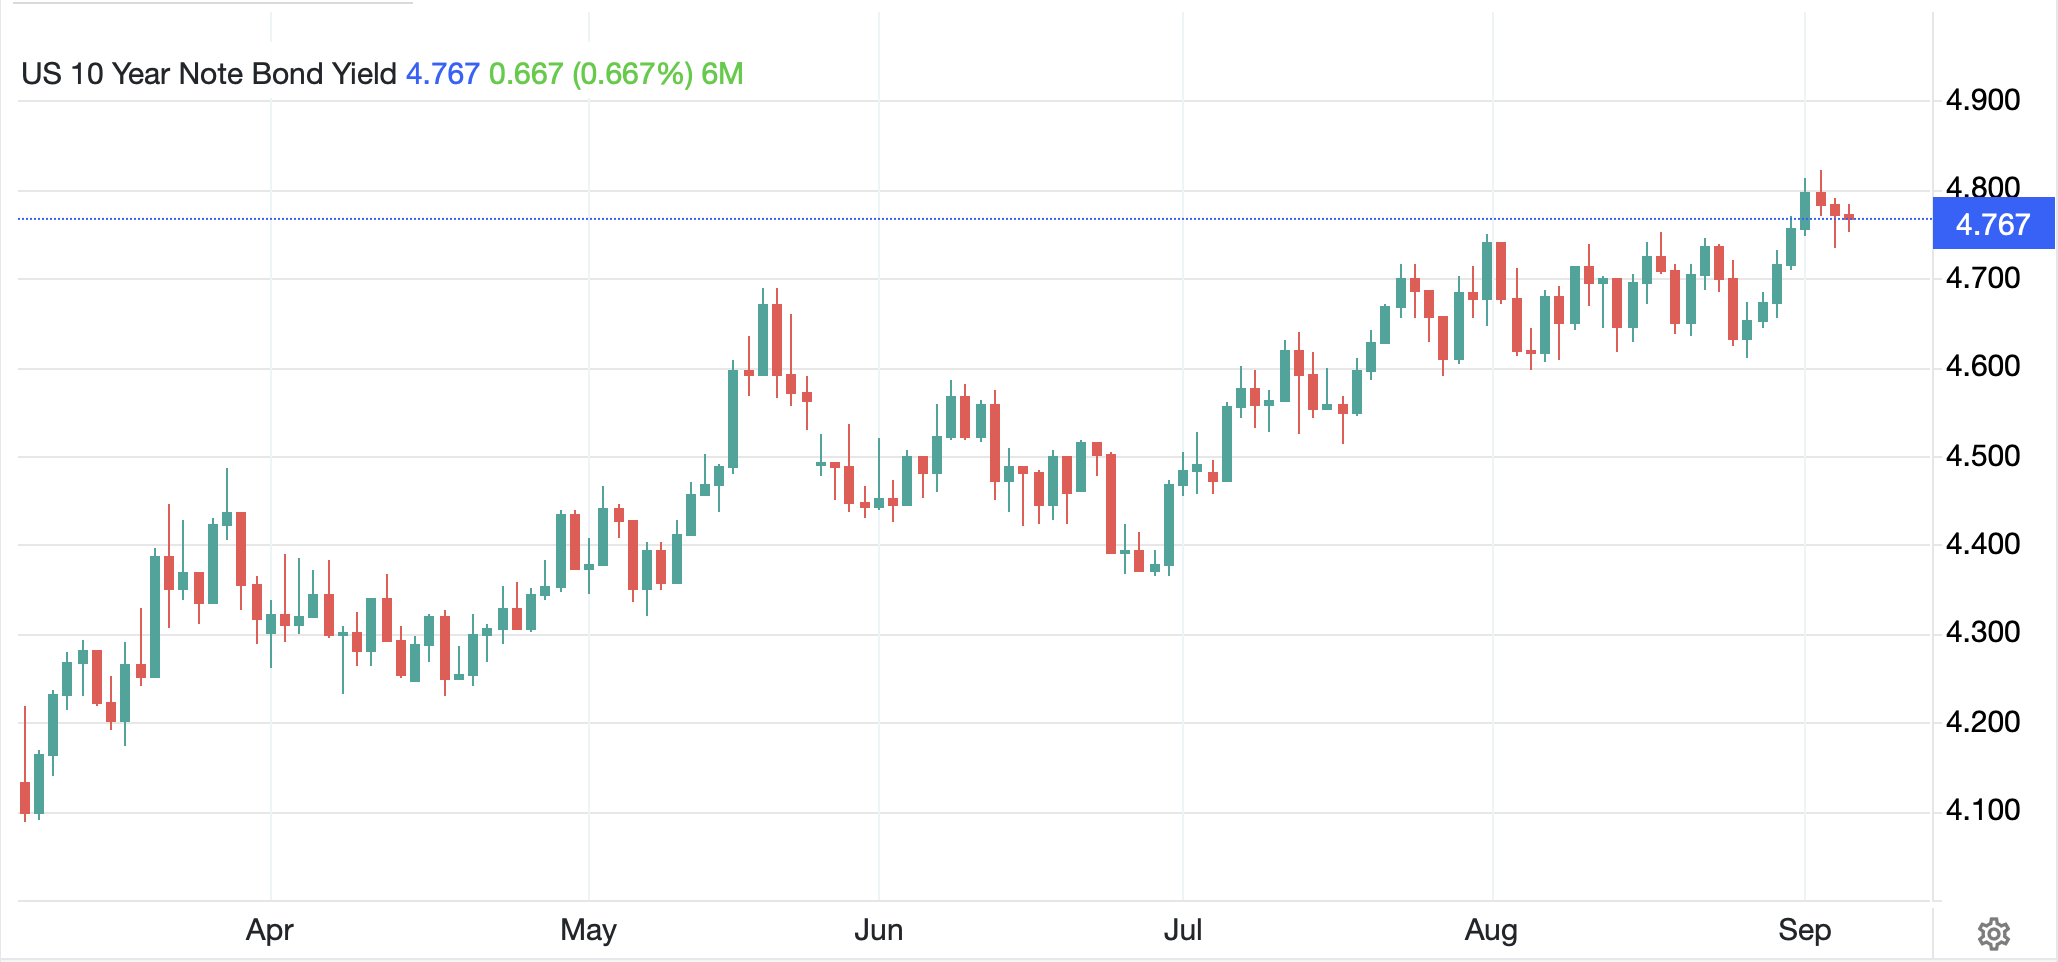
In the bond market, Treasury yields (-1bp) have stopped climbing for now although remain at the upper end of their recent range as you can see in the below tradingeconomics.com chart

European sovereign yields have edged higher by 1bp across the board this morning and JGB yields, perhaps on the alleged buying by GPIF which led to USD sales in the FX market yesterday, have slipped by -4bps.  That is, of course, exactly what FinMin Katayama wants to see.

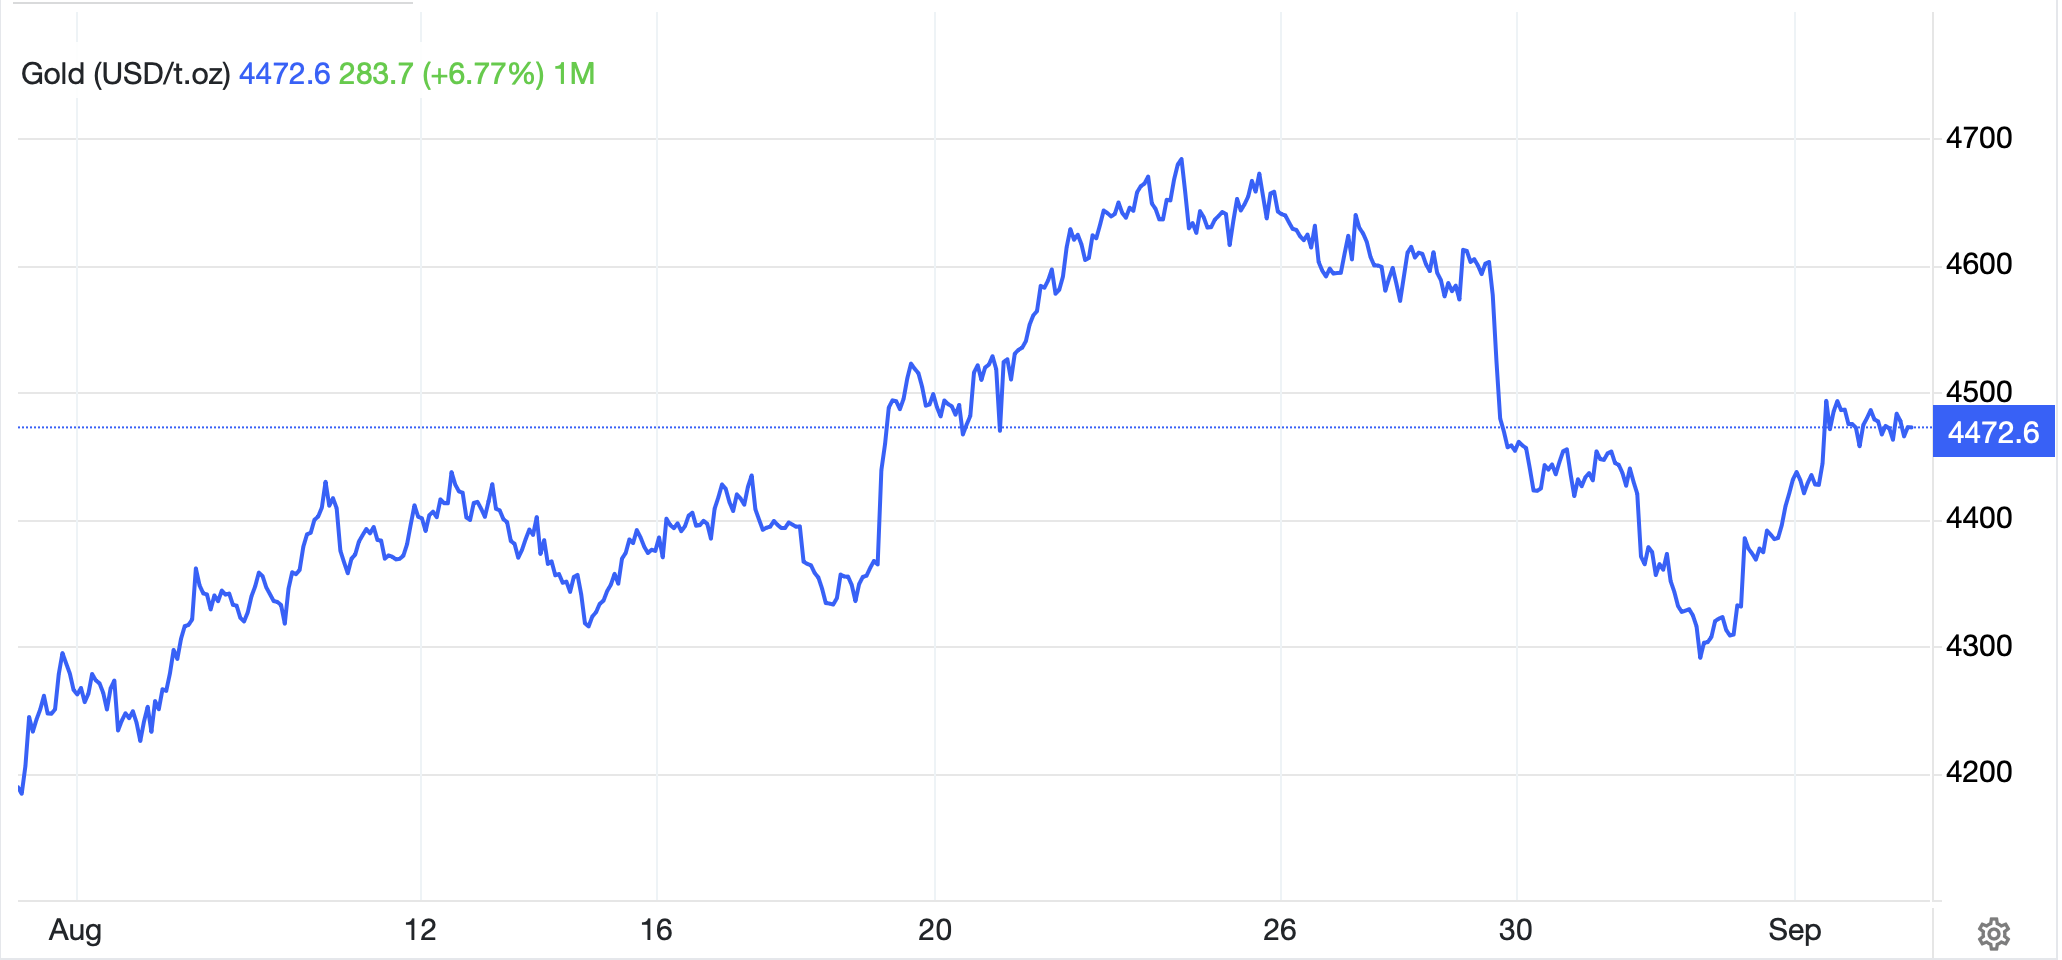
In the commodity markets, oil (-1.0%) is trading just above $90/bbl as the escalation of fighting in the Gulf has not had many headlines lately, although I think it continues.  Many have made the point, though, it is the products that are the driver, so diesel, jet fuel and gasoline are what matter to both measured inflation and the national zeitgeist.  In the metals markets, this morning prices are very little changed although as you can see in the chart below, gold’s recent sharp decline has been reversed to the tune of about 50% of the move.

Source: tradingeconomics.com

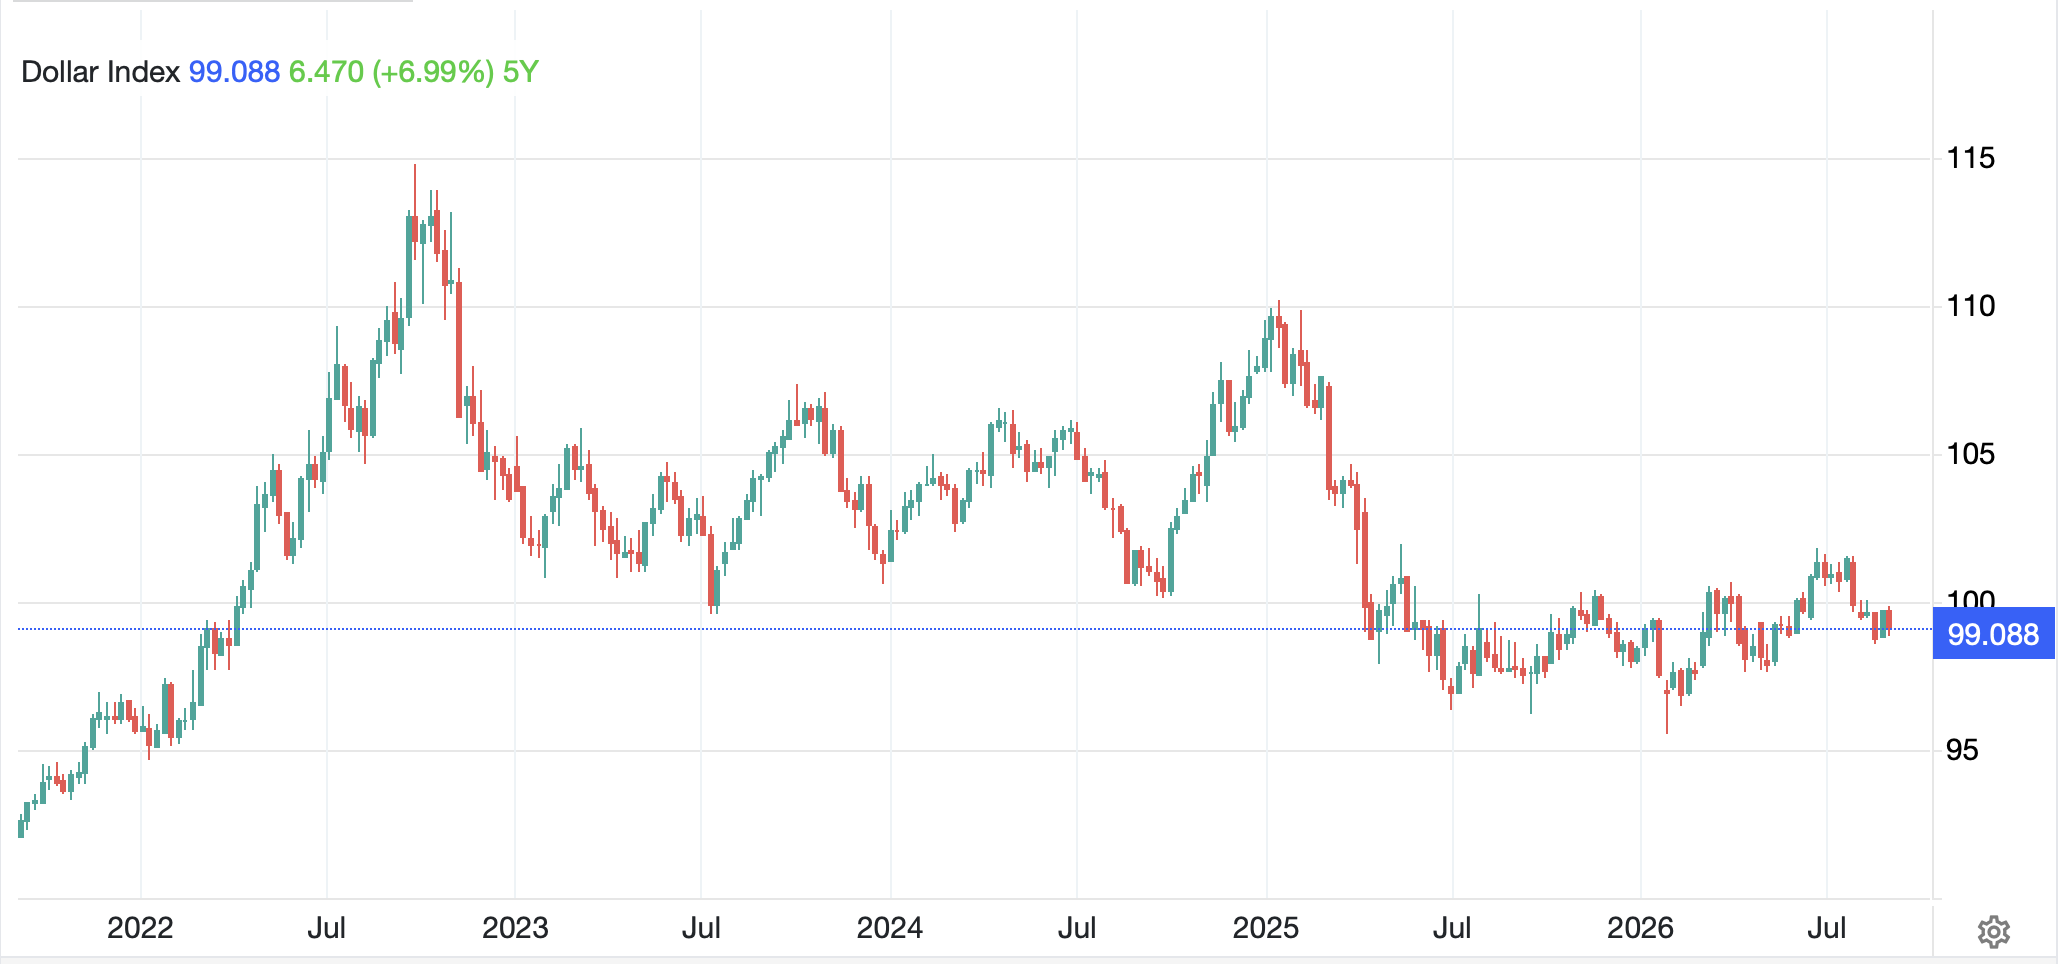
And finally, the dollar, away from the yen, is also largely holding its breath for the NFP report this morning.  KRW (+0.45%) continues to be the big winner over the past several months as capital continues to flow into Korea and its tech industry and tech stocks.  But if we look at the DXY, it is trading just above 99.0 this morning and frankly, if we step back and take a longer-term view of the dollar, away from the histrionics that many pundits try to add, it hasn’t gone anywhere since April 2025 as you can see below.  You may recall the gnashing teeth describing the dollar’s 15% decline in the first six months of 2025 as being ‘unprecedented’, but one need only look at the chart below to see a larger decline in the second half of 2023.  That was much ado about nothing.  But since then, 99 +/- 3 cents has been home.

Source: tradingeconomics.com

And that’s all there is today.  We simply await the data before the next move.

I want to thank all of you who mentioned Marvel, he showed beautifully yesterday but we did not get picked for an award.  We have two big shows this weekend and then the Nationals are the first weekend of October. 

Good luck and good Labor Day weekend

adf

Center of Blame

It's not just the 'economy's heat
Why we're at the edge of our seat
But also, Iran
Where this all began
That's left traders feeling downbeat

Thus, crude oil's back in the game
As being the center of blame
How high can crude rise
Til bonds paralyze
Activity, snuffing that flame

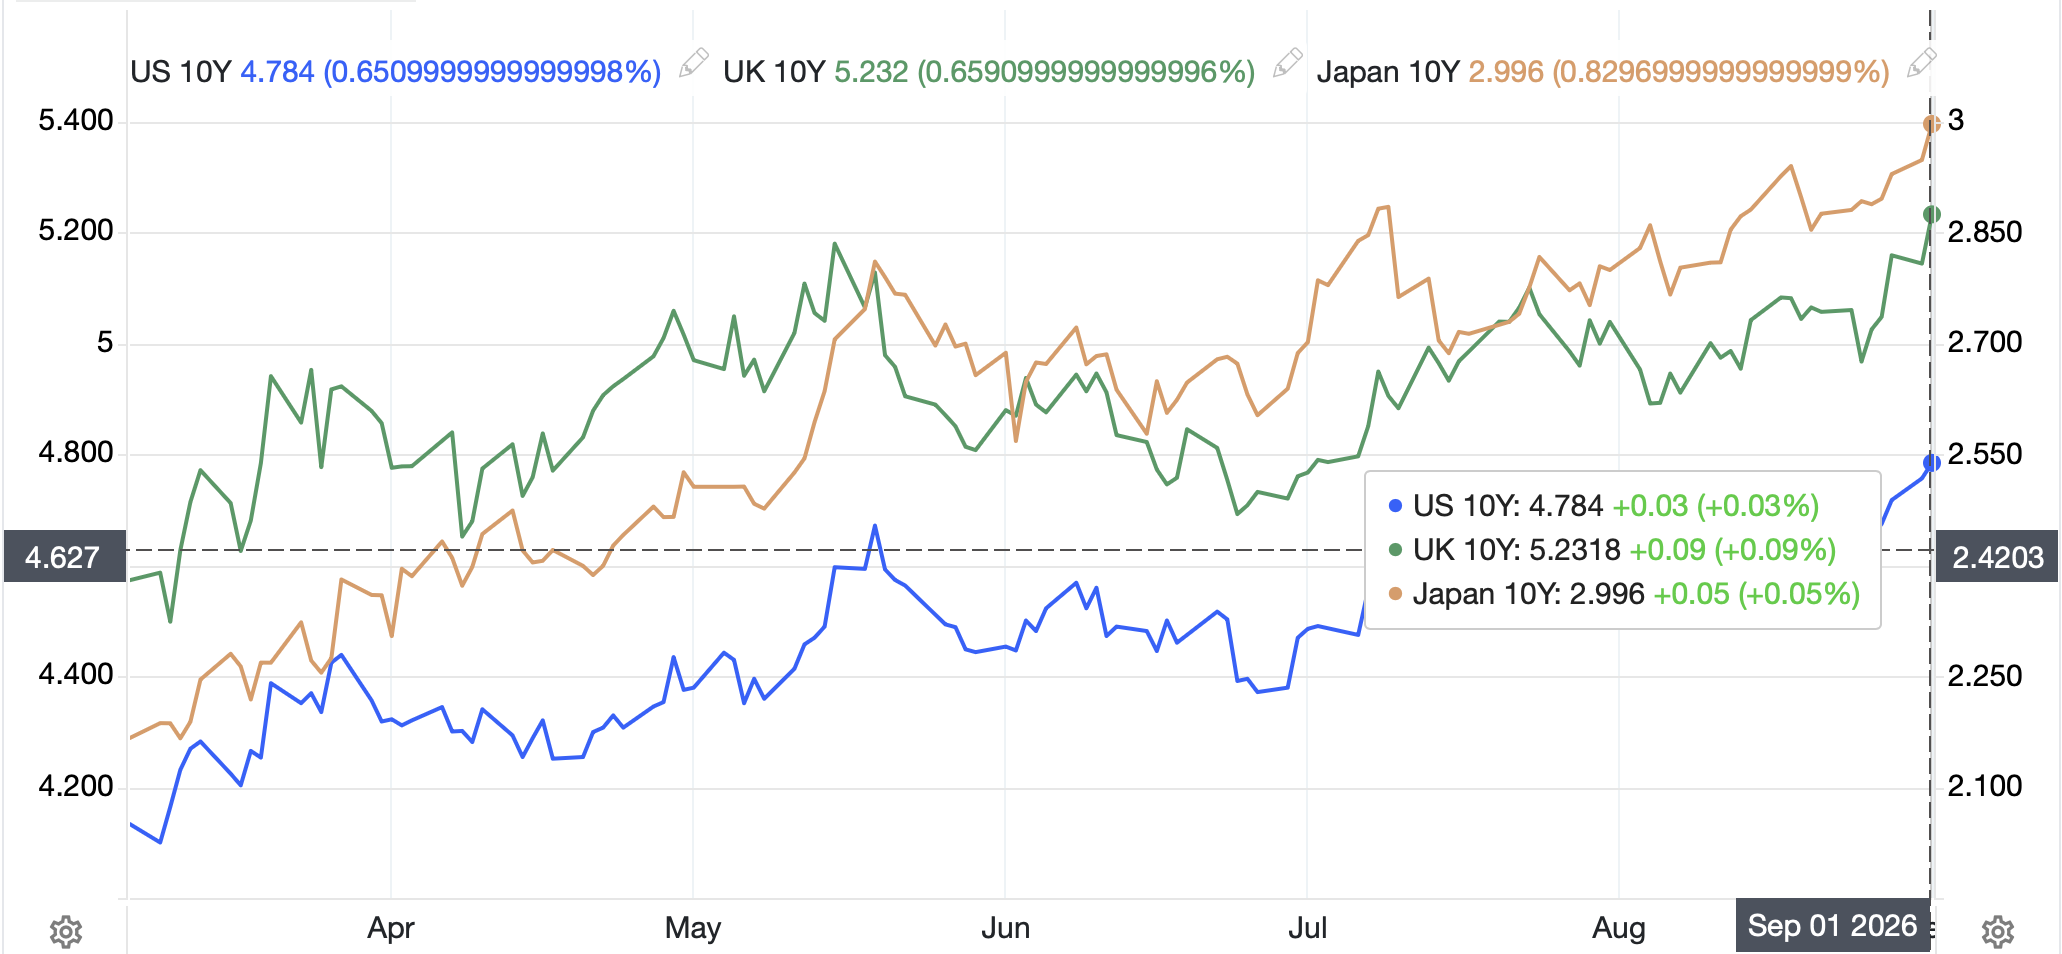
Bond yields remain topic A this morning as they continue to climb around the world.  There are many opinions as to why that is happening but I think it boils down to either 1) increasing deficit spending by governments around the world resulting in significant increases in supply thus driving yields higher, or 2) rising oil prices after the US-Iran conflict has seen an increase in military action on both sides thus driving the inflation narrative further.  Arguably, it is a combination of both these things.

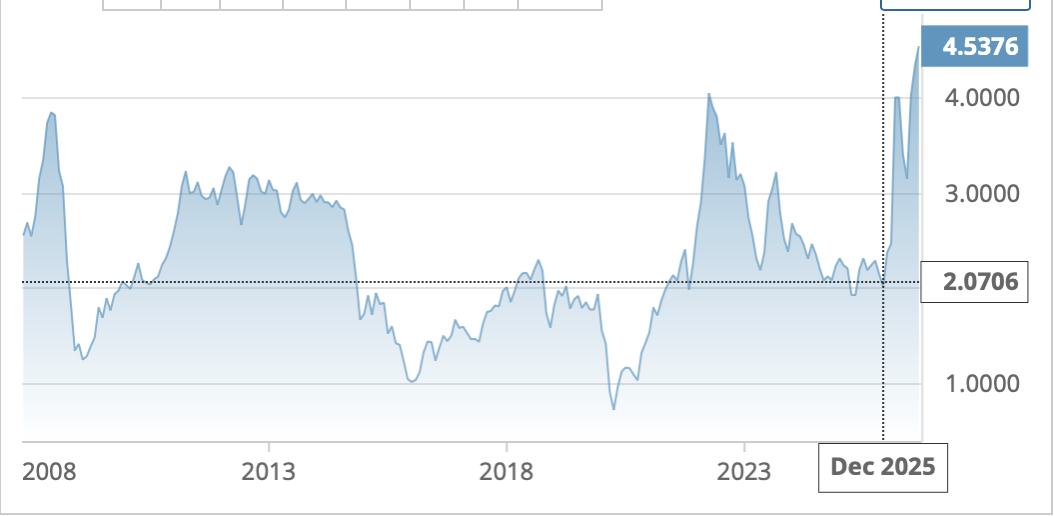
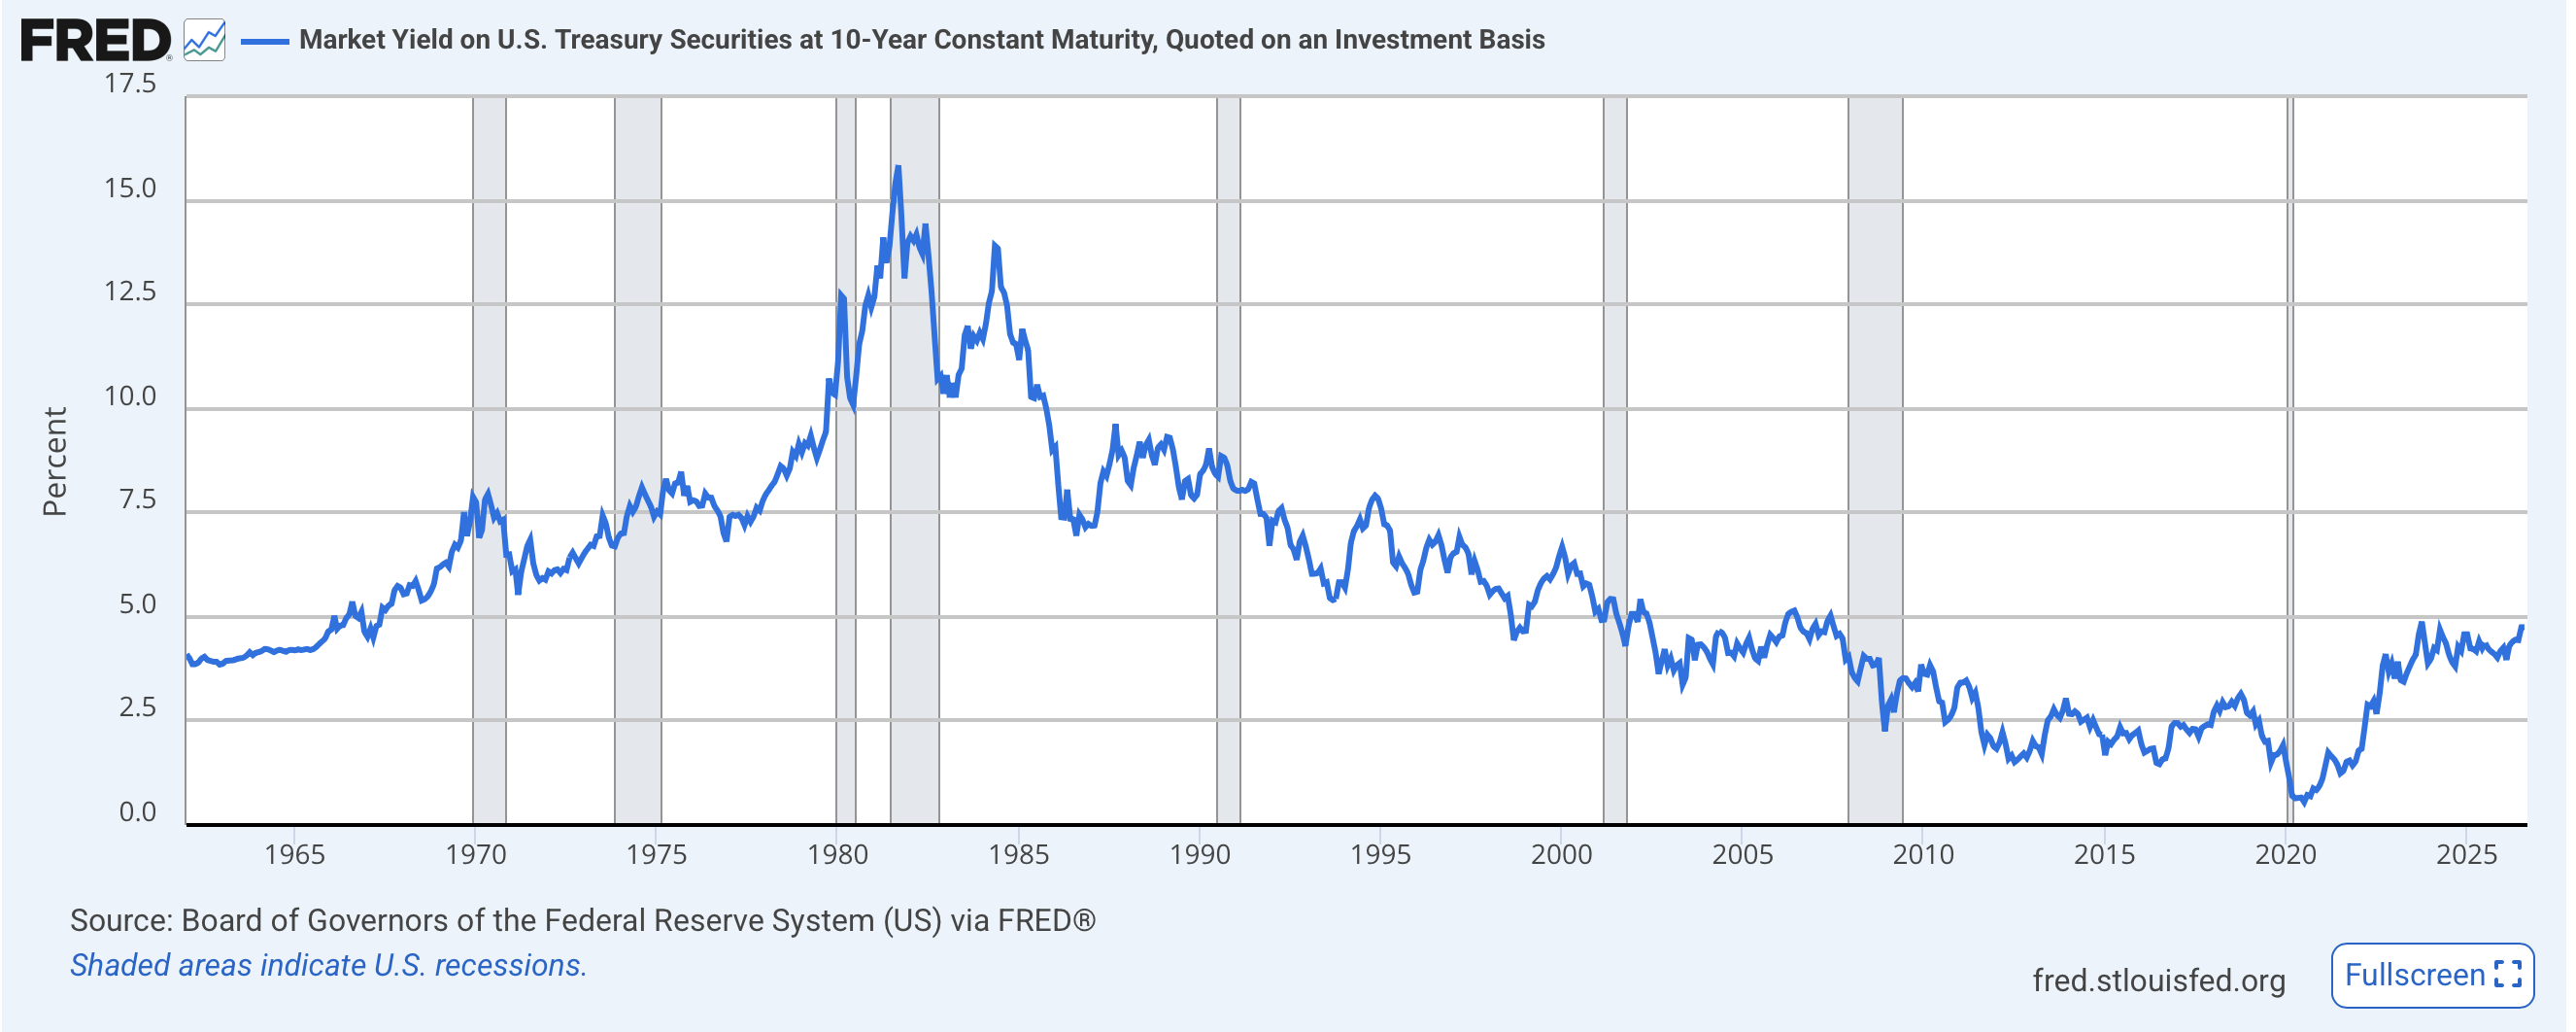
Much has been written that these are the highest yields since 2011 or 2008 (or 1996 in Japan’s case) and how that makes them, somehow, more dangerous.  Or at least that is the implication.  When it comes to bond yields though, I always like to maintain perspective by looking at the long-term history of 10-year yields.  If you look at the chart below from FRED, I think it fair to ask the question, what is the aberration, current yields at 4.8% or yields at 2.5% or lower seen post the GFC?

As I have written before, the average 10-year yield over the past 60 years is 5.81%, still 100bps higher than current levels.  I understand that debt outstanding has grown dramatically over the years, but it’s not like it wasn’t growing during Covid.  In fact, it was exploding higher then too.  Ultimately, the original sin is excess government spending relative to the economy’s overall size and, unfortunately, the underlying thesis of RIH is that is not going to change.  To me the question becomes, how does one prepare for the impacts of this policy.  And remember, this is not a US only policy, it is now the default policy of every government in the world, save perhaps Switzerland.

How can it get fixed?  That is the $64 trillion question and there is no easy answer.  If governments around the world reduced their spending, especially on things that add no true economic value (subsidies for green energy are huge and immediately come to mind), it would help but not solve the problem.  Entitlement spending is the major expense everywhere in the G10 and as those nations age demographically, that will only get worse. 

I haven’t discussed the 4th Turning in a while, but this is all of a piece with that scenario, massive institutional changes as old institutions, be they corporations, central banks, government structures or educational organizations, will be redesigned for the new age.  Perhaps that is the promise of AI, a “voice” that can analyze history and help guide future decisions.  Alas, mankind is mankind, and I don’t foresee that changing so whatever comes out on the other side, it, too, will only have four generations of life!

Was it hint or threat?
Could Ueda hike fifty?
No breath holding, please

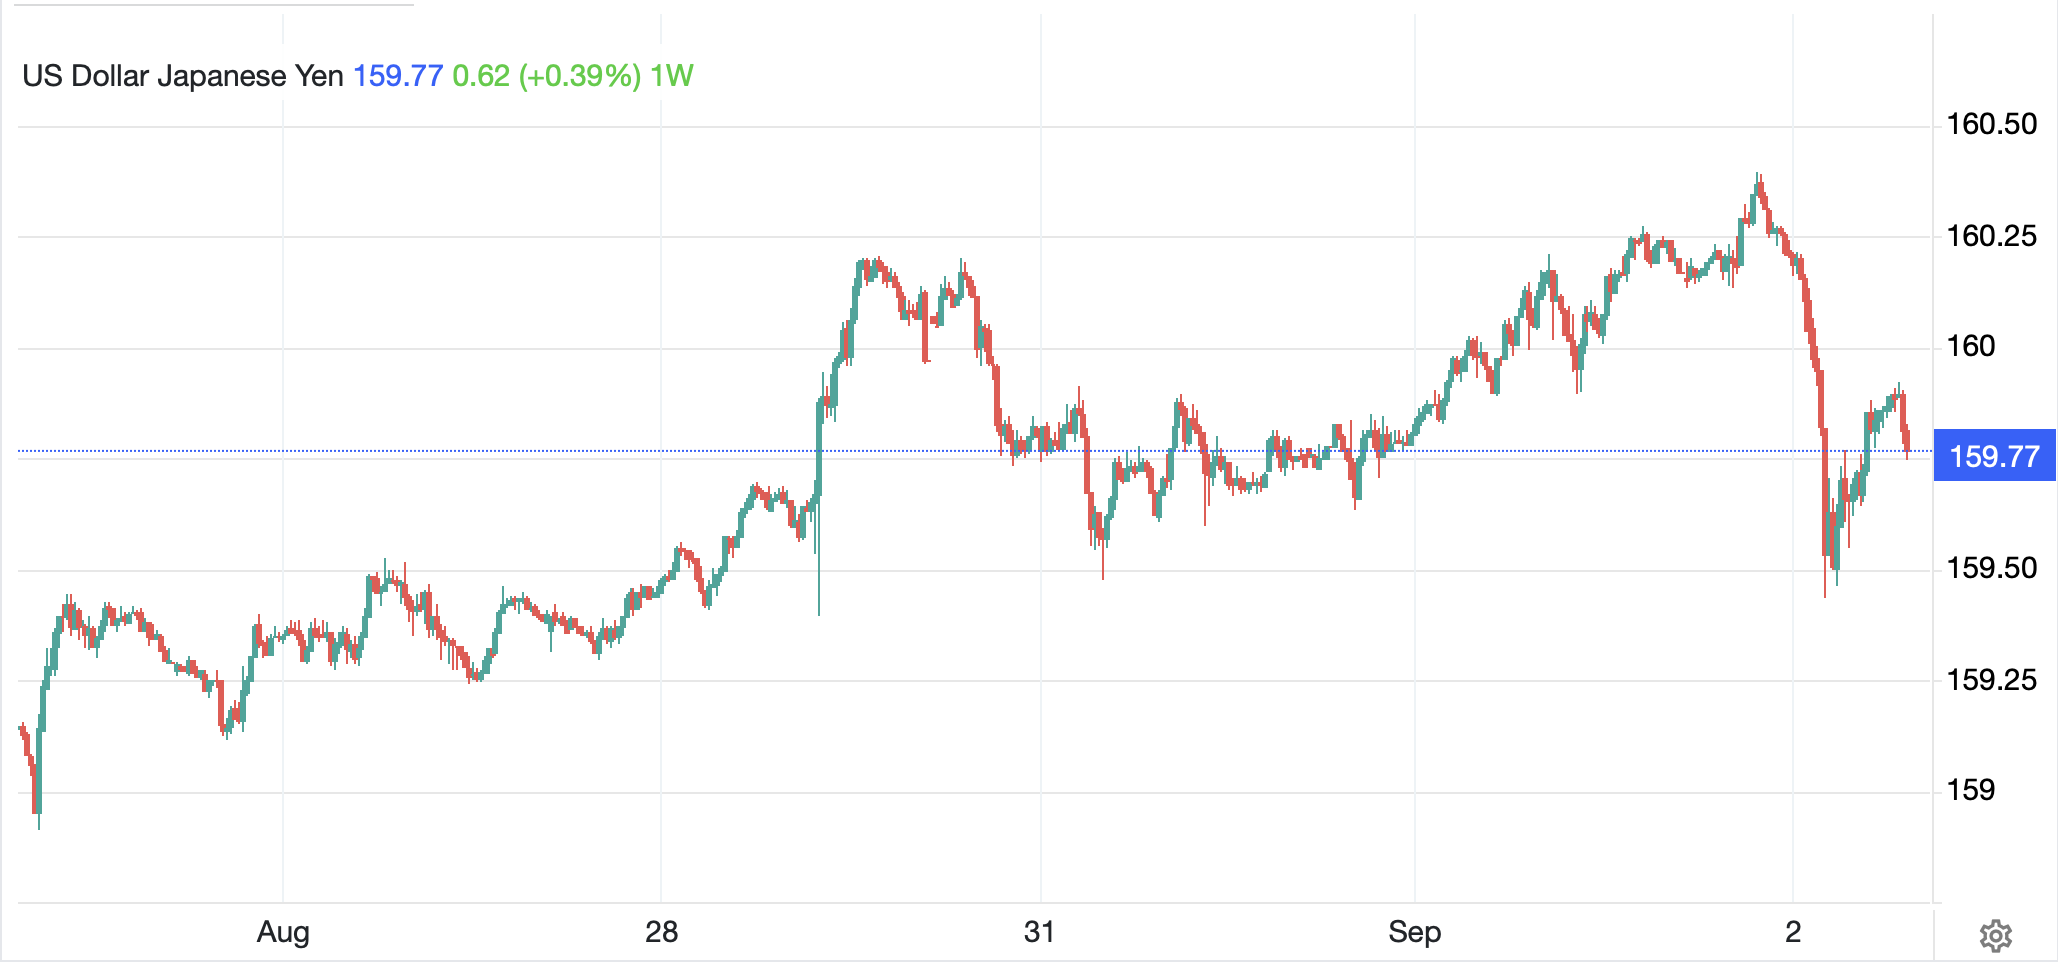
The other story of note this morning was that BOJ Board Member Takata, a known hawk, gave a speech and indicated that the BOJ could surprise with a 50bp hike this month, or perhaps hike two months in a row rather than their current once every six months cadence.  Bloomberg’s article was succinct.  This story did have a modest impact on the yen (+0.25%) as you can see in the chart below.

Source: tradingeconomics.com

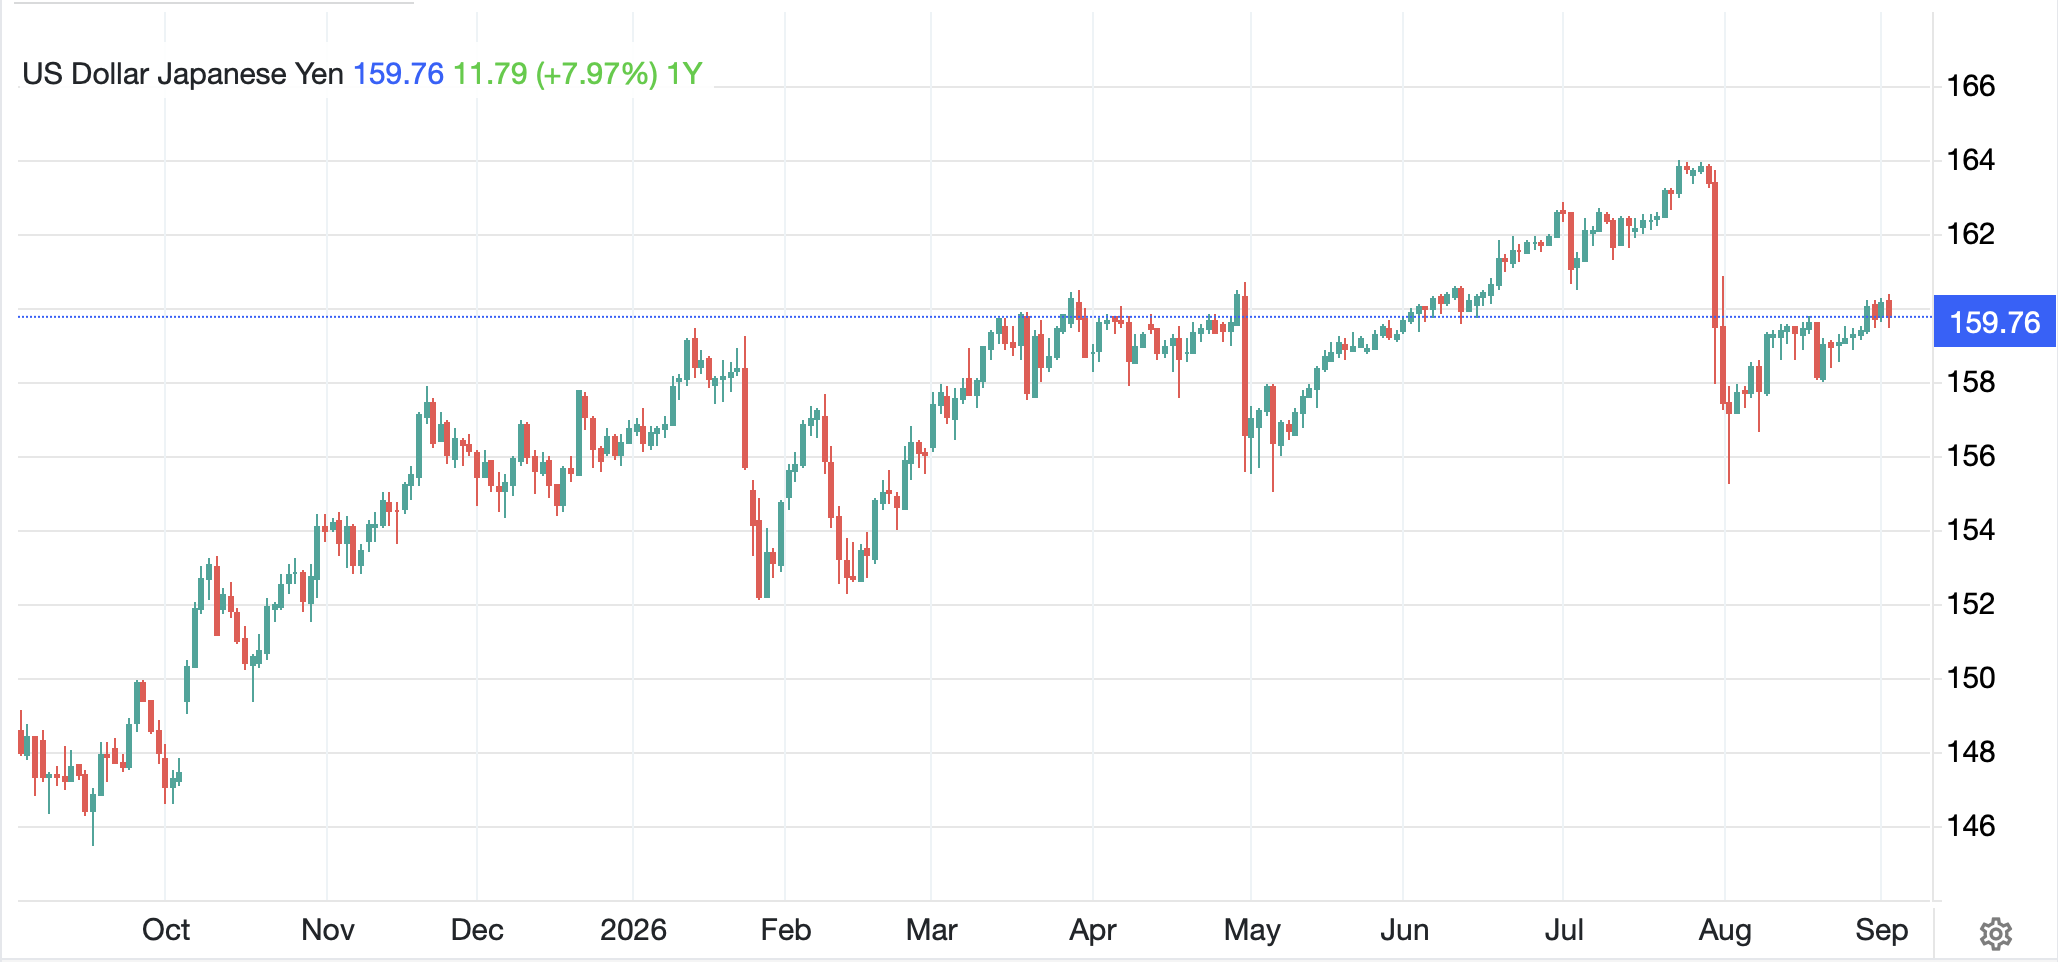
But if we step back from the 1-week view above to the movement over the past year, as per the below chart, it doesn’t appear to have had a significant impact.

Source: tradingeconomics.com

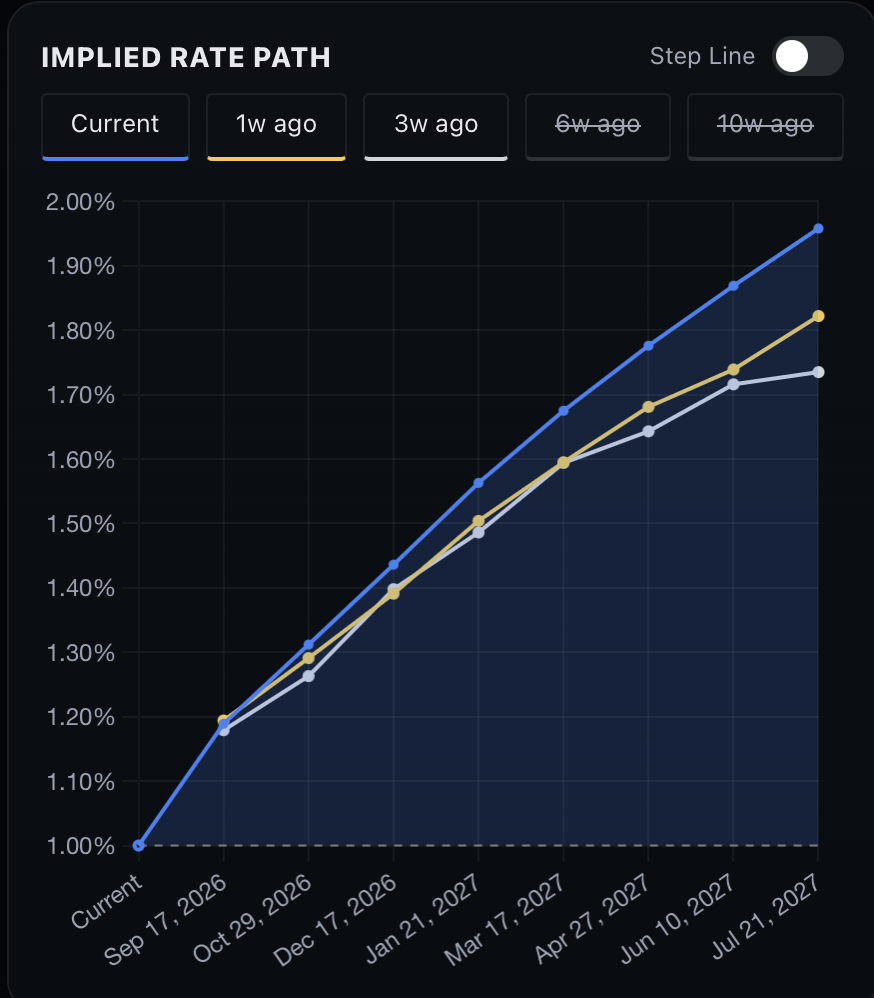
The post-intervention pattern remains perfectly intact.  However, it did help increase the probability of further rate hikes by the BOJ as you can see in the rateprobability.com chart below.  The blue line is the current market compared to previous readings, with the market now expecting a total of 100bps of hikes during the next year. 

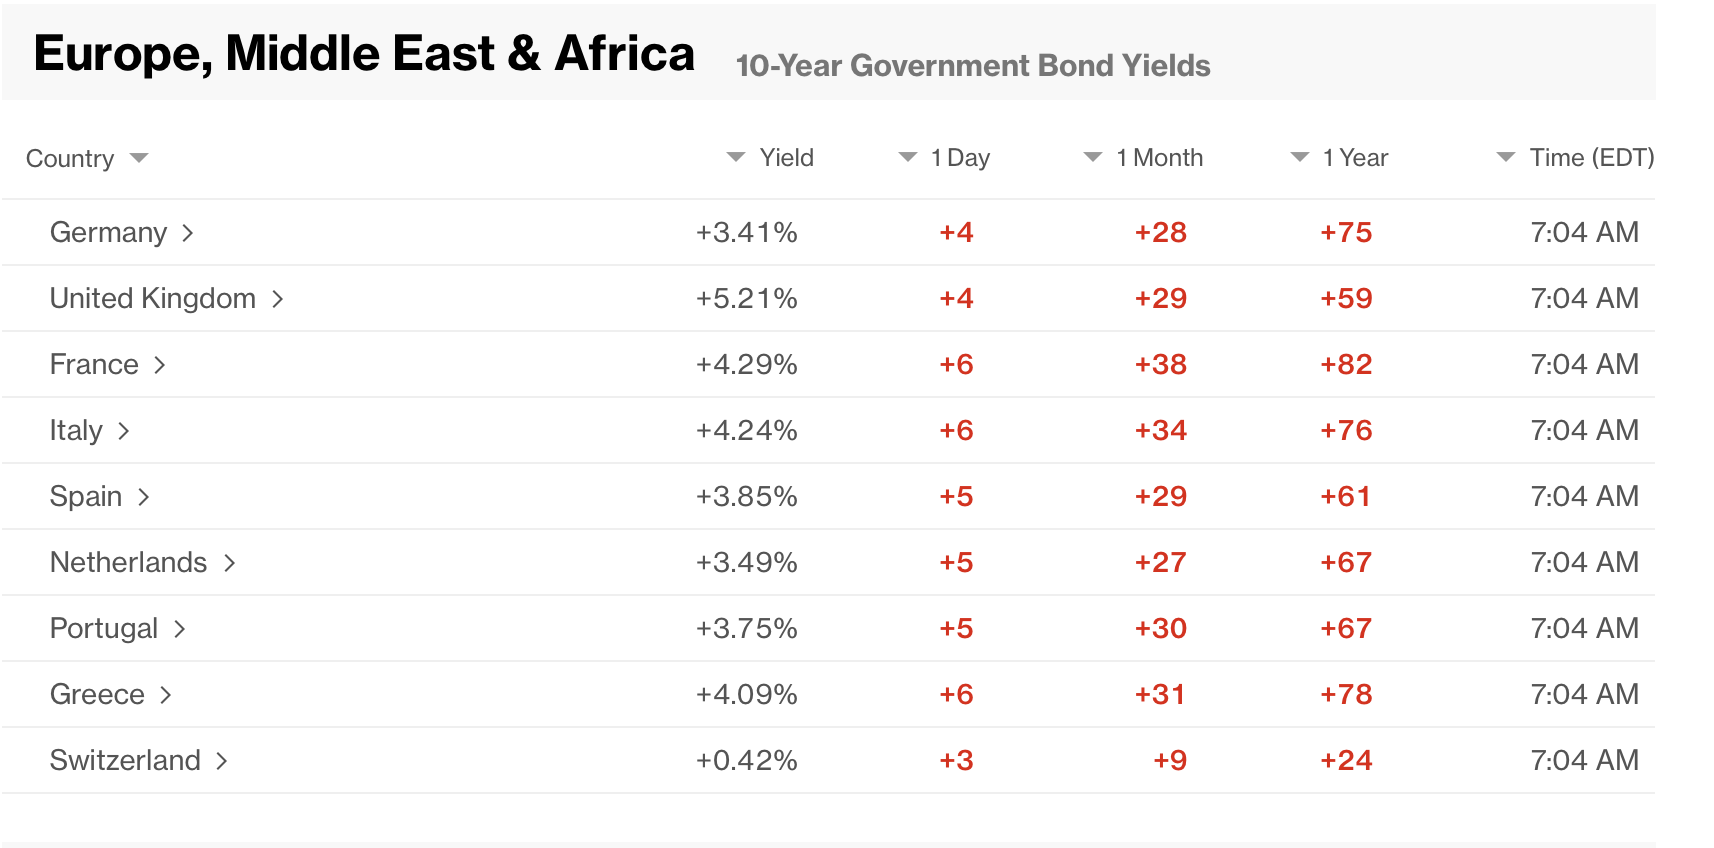
Alas, that did not help the JGB market, where yields remain at the 3.0% level, although they did not rise further last night.  Speaking of bonds, Treasury yields, which climbed 3bps yesterday, are unchanged this morning but European sovereign yields are all higher by between 3bps and 5bps, with France the worst case.

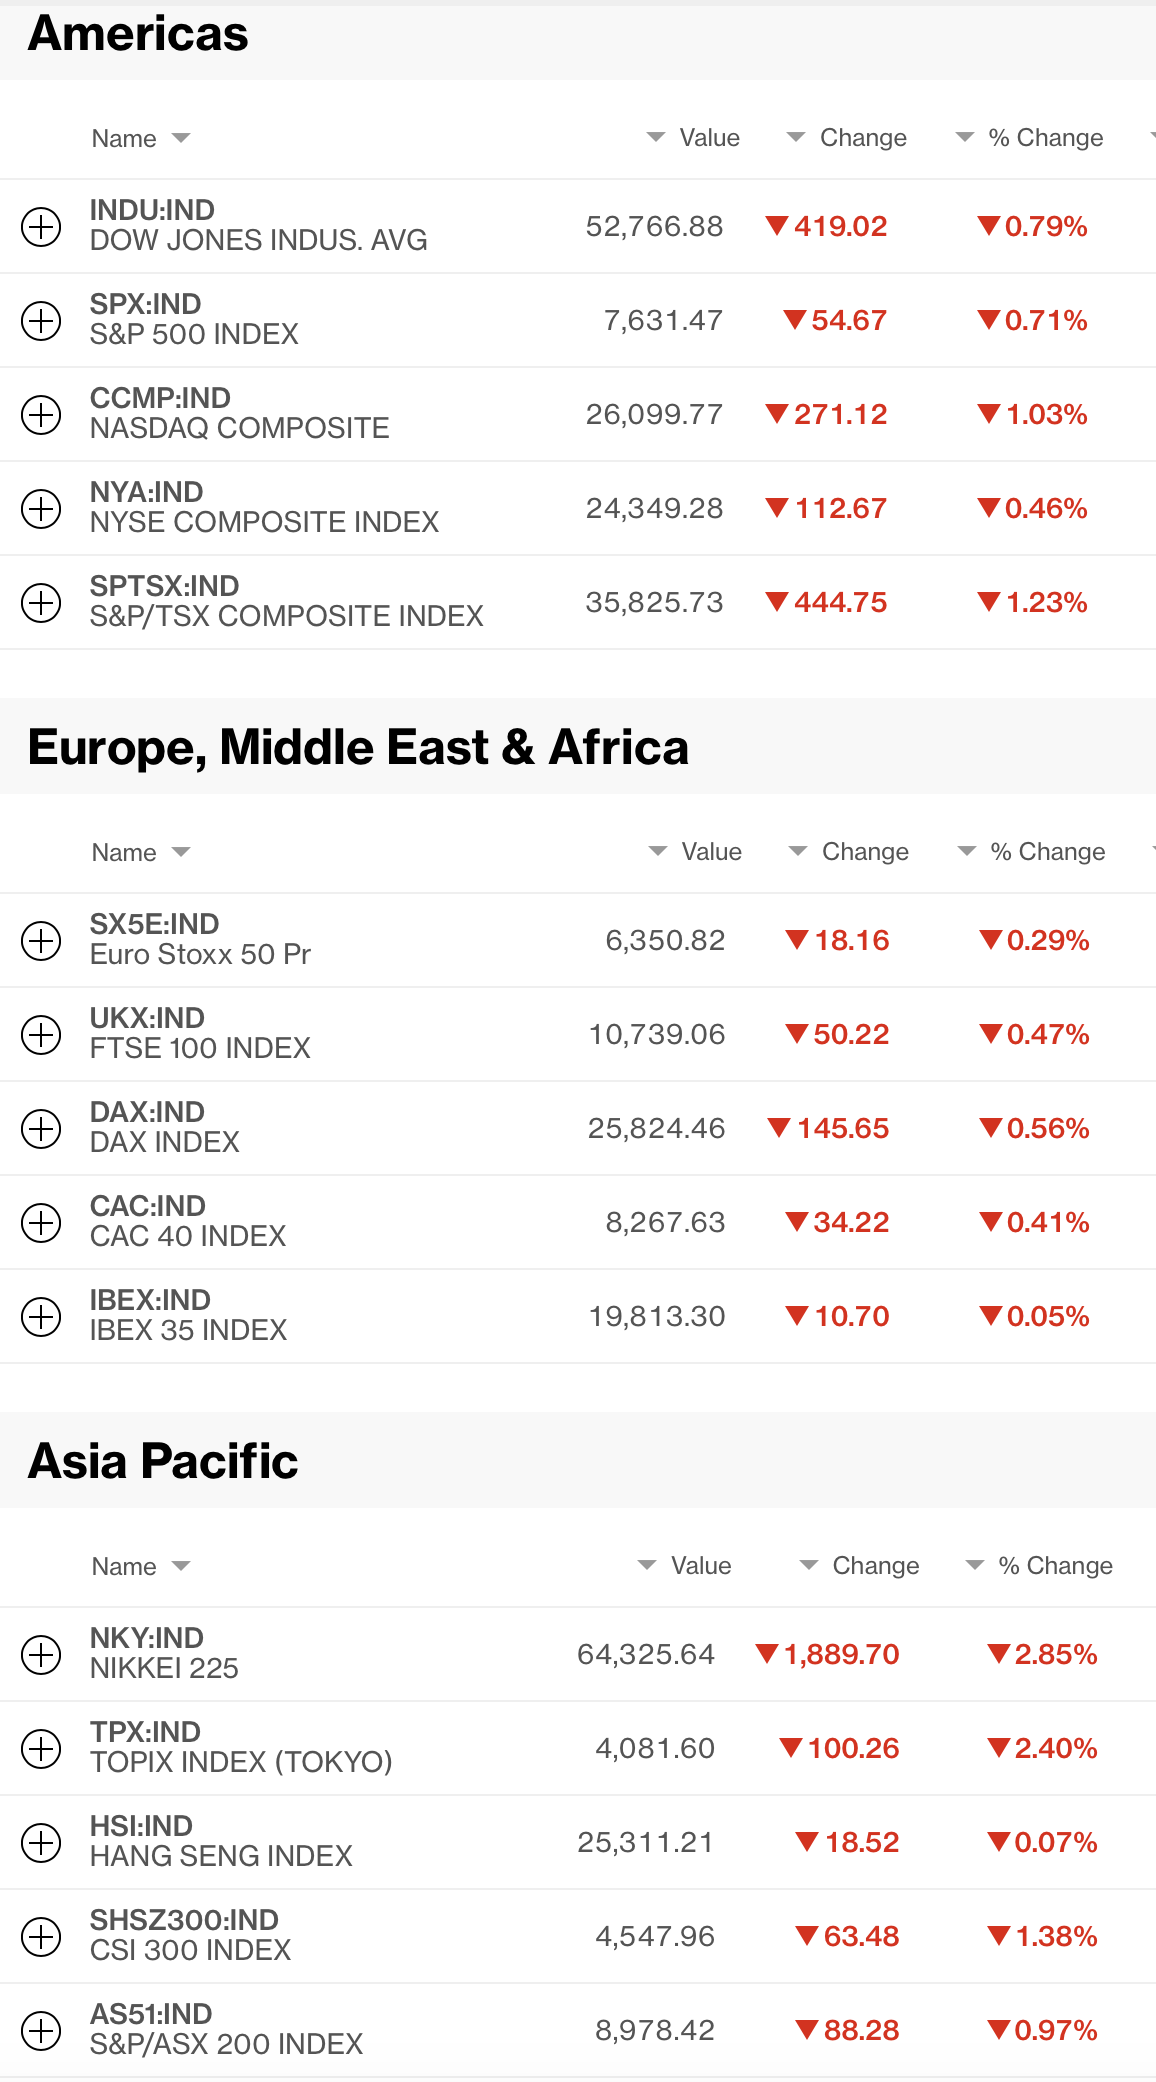
Looking at equity markets, red is the color of the day as every major market either declined last night or is in the process of doing so as I type as per the below Bloomberg screenshot.

Certainly, there is a great deal of angst in equity markets right now, but when I looked at the S&P 500, it is still just 2.5% off its all-time highs from the middle of August.  And this morning, while the NASDAQ futures are lower by -0.7%, the other two indices are unchanged as we await this morning’s ADP data (exp 47K) and this afternoon’s Beige Book.  Higher yields are always a struggle for equity markets, but there is no collapse yet, that’s for sure.

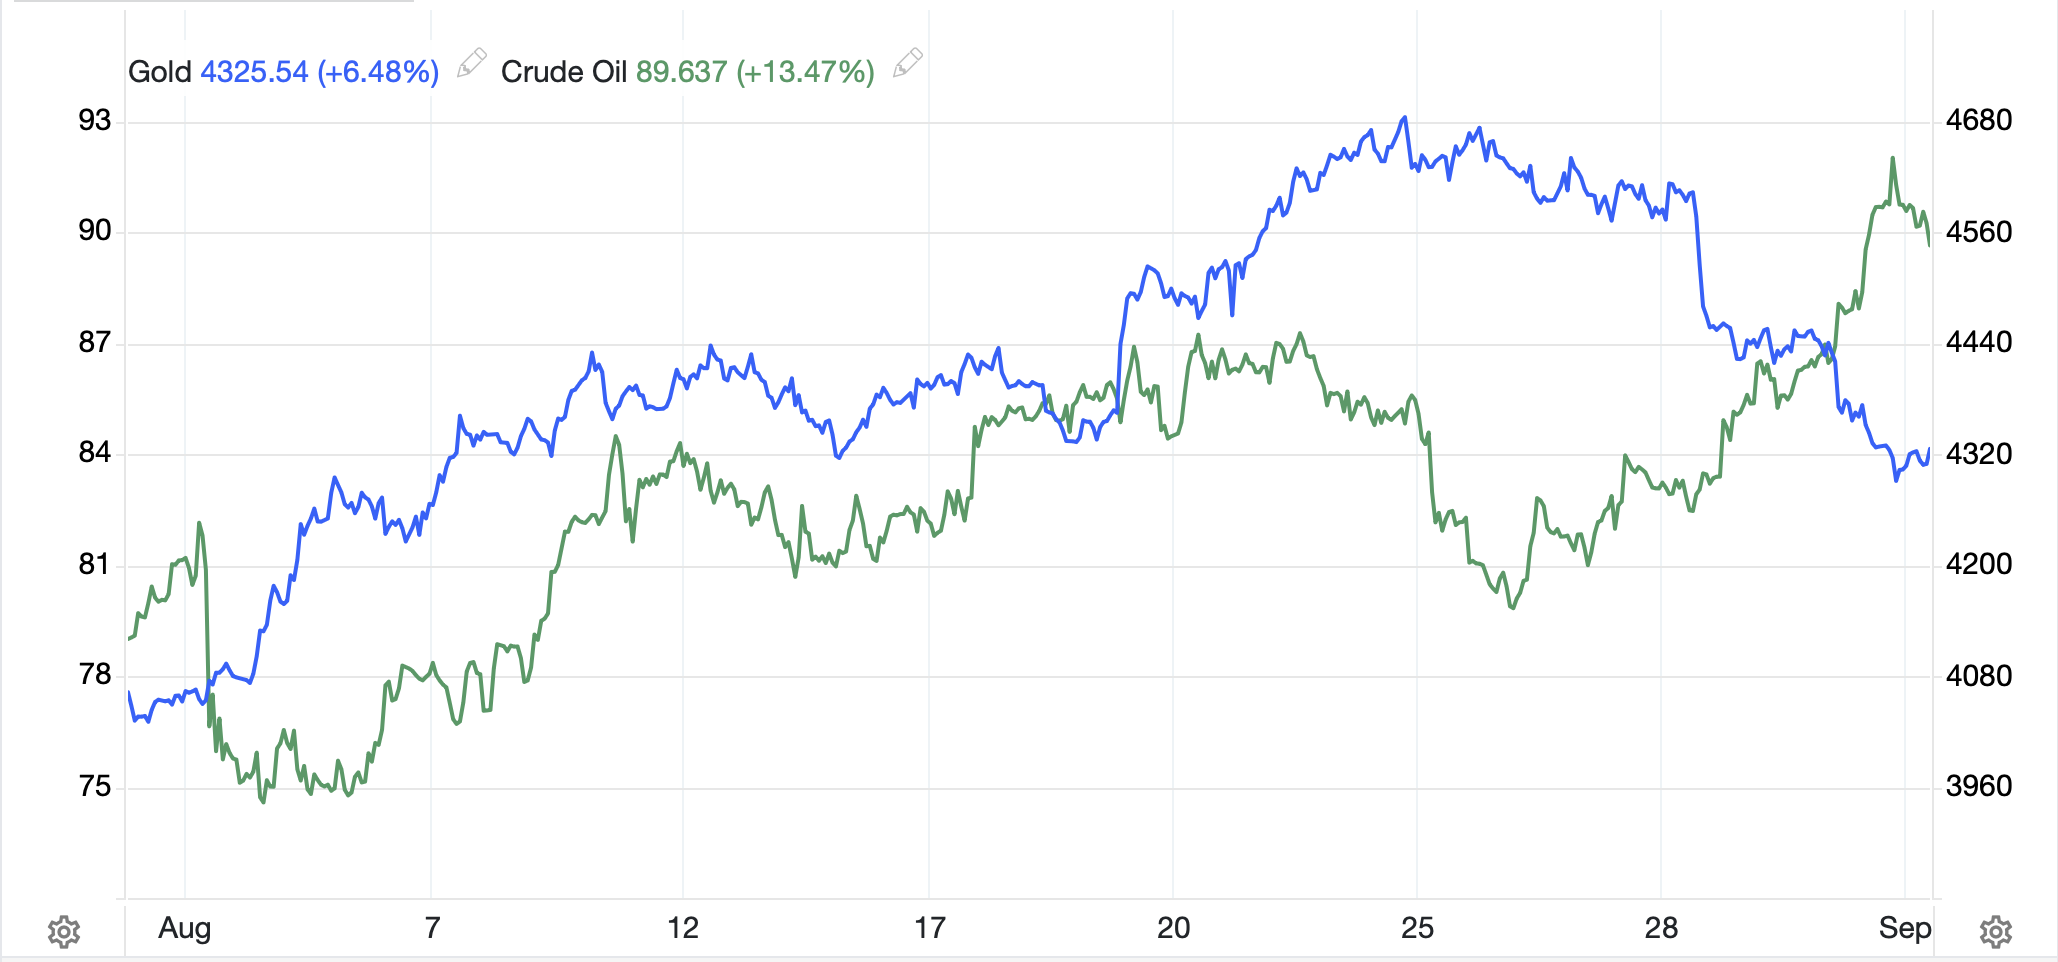
In the commodity markets, oil (-0.7%) has backed off the highs from yesterday and has traded back below $90/bbl, although that remains far higher than just a few weeks ago.  The escalation of fighting has certainly got traders nervous.  As to the metals markets, while they have been getting crushed the last few days, this morning they are essentially unchanged, perhaps consolidating after that rough ride.  You may remember there had been a strong negative correlation between oil and gold for a while which seemed to dissipate during the summer when things in the Gulf settled down.  Well, as you can see in the chart below, that negative correlation is back in spades for the past two weeks.  We will have to see how long that lasts, as historically, the two traded together more often than not.

Source: tradingeconomics.com

Finally, the dollar is creeping higher again this morning with the DXY (+0.1%) a pretty good proxy of the entire market with just a few exceptions.  We already noted the yen but NZD (-1.2%) fell sharply after the RBNZ raised rates by 25bps, as expected, but sounded more dovish in their comments afterwards.  As it happens, that helped the NZ stock market buck the negative trend as well.  The other outlier was KRW (+0.8%) which continues to rally strongly on positive inflows and positive economic news.  Last night, inflation data was better than expected, which helped the currency, rather than set it up for a rate hike.

And that’s really it today.  We also get Factory Orders (0.6%, 0.2% ex Transport) and the EIA oil inventories.  ADP could be interesting, but all eyes remain on Friday’s NFP on the data front.  And of course, who knows what will happen in the Gulf.

There will be no poetry tomorrow as we show GCH Nubia’s Take Your Breath Away on the road to the Nationals next month.

Good luck

Adf

Markets This Hated

No matter the nation you view
Its bondholders now see to rue
Their previous buys
And under that guise
Won't buy and bonds that are new

So, yields have been rising with haste
Though currencies have not debased
But markets this hated
Have often created
Reversals, which many then chased

Global Bond Yields Surge as Oil Prices Fuel Inflation Worries

The above article in the WSJ this morning captures the current zeitgeist in markets and seeks to explain why everything has turned bad.  Certainly, the rebound in oil prices (+2.5%) is putting pressure on economies around the world, but so, too, are the unrestricted spending plans seen throughout the G10, and frankly across most of the planet.  My take is that ‘run it hot’ (RIH) has become the economic strategy around the world.  Perhaps the only outlier here is China, but even that is not really true, they are just running it hot differently.  While most governments are responsive to their peoplevoters, Xi Jinping has demonstrated time and again he doesn’t really care about that.  Rather he has his strategic goals of global domination and is pushing his economy to achieve that.

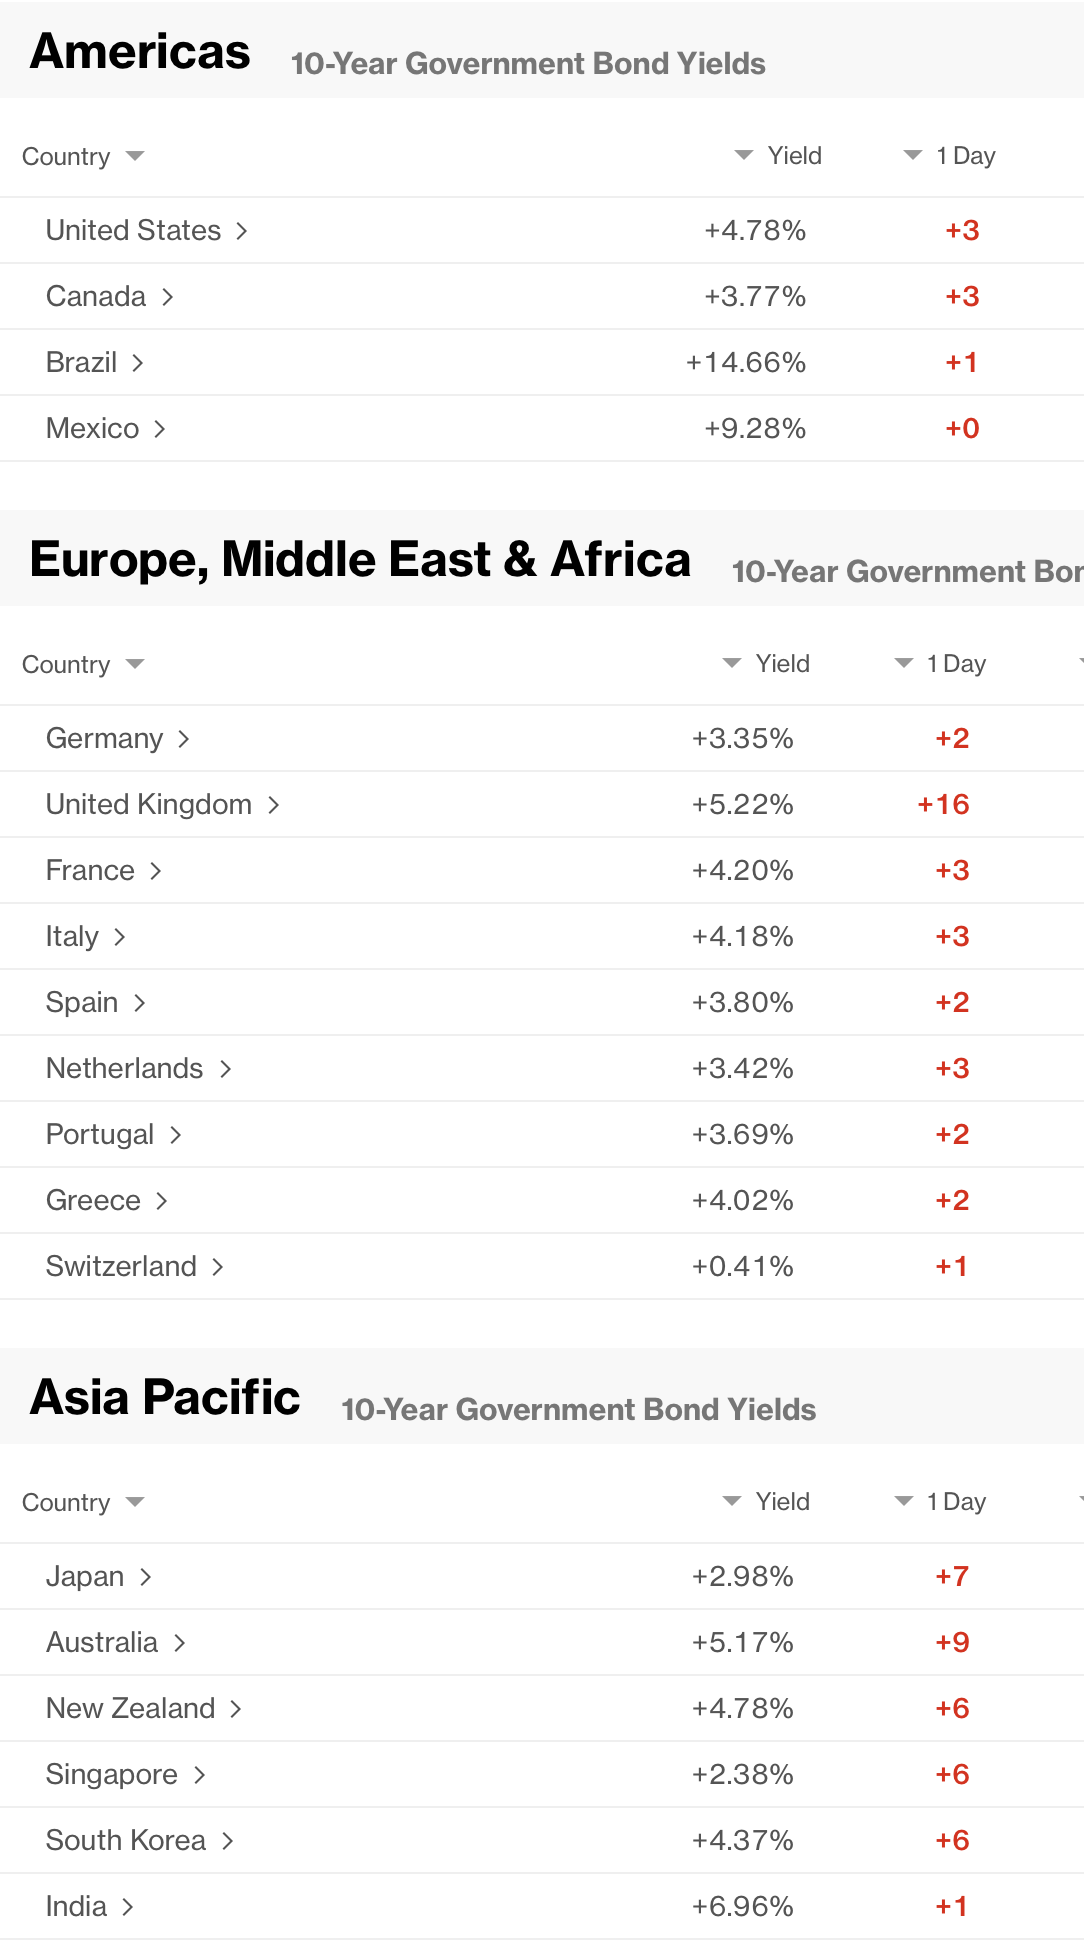
The upshot is that bond yields are rising and as you can see in the chart below, it is uniform, this is not just a US phenomenon.  In fact, much ink has spilled that 10-year JGB yields have traded to 3.0%, their highest level in 30 years.

Source: tradingeconomics.com

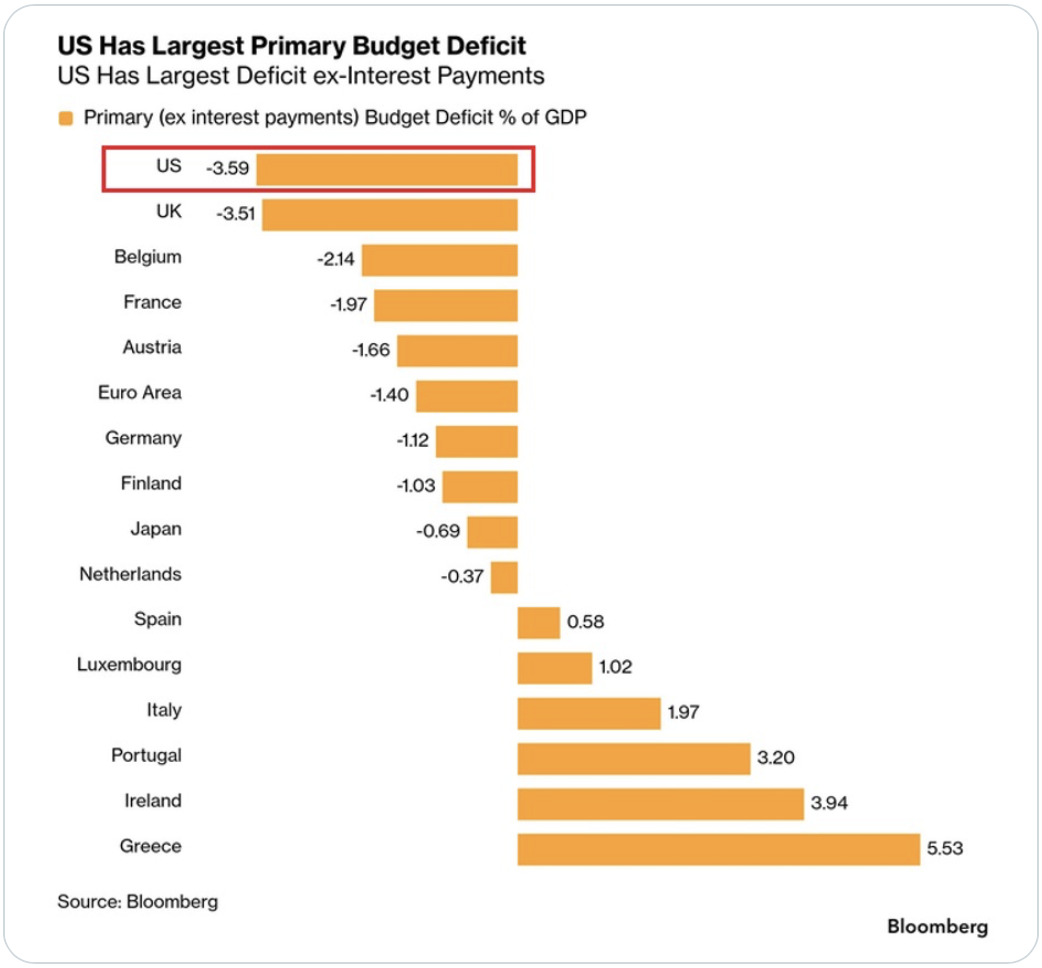
Now, as I said at the top, oil prices are clearly one of the pressure points as there are fears it will feed into higher inflation, thus investors are demanding higher yields.  And the other big story, which in my view is more concerning, is that governments are running increasingly larger budget deficits as the guns AND butter approach has become de rigueur in polite circles, or at least political ones.  In fact, the concern is that governments are increasingly running primary budget deficits (spending less interest payments) which is why debt loads are growing so rapidly.

Source: @KobeissiLetter

And this leads to the RIH theory.  If a country can grow its nominal GDP fast enough, then the denominator in the debt/GDP ratio will rise more quickly than the numerator thus reducing that ratio and implying a healthier fiscal outlook.  Now, nominal GDP is the sum of real GDP, the number that is reported, plus inflation and that sum can be any combination.  For instance, a nominal GDP growth of 7% could easily be 2% real GDP and 5% inflation, or vice versa.  In the RIH scenario the typical outcome is that wages rise, corporate earnings rise, stock market values rise…and prices rise.  The last point being the key political question.

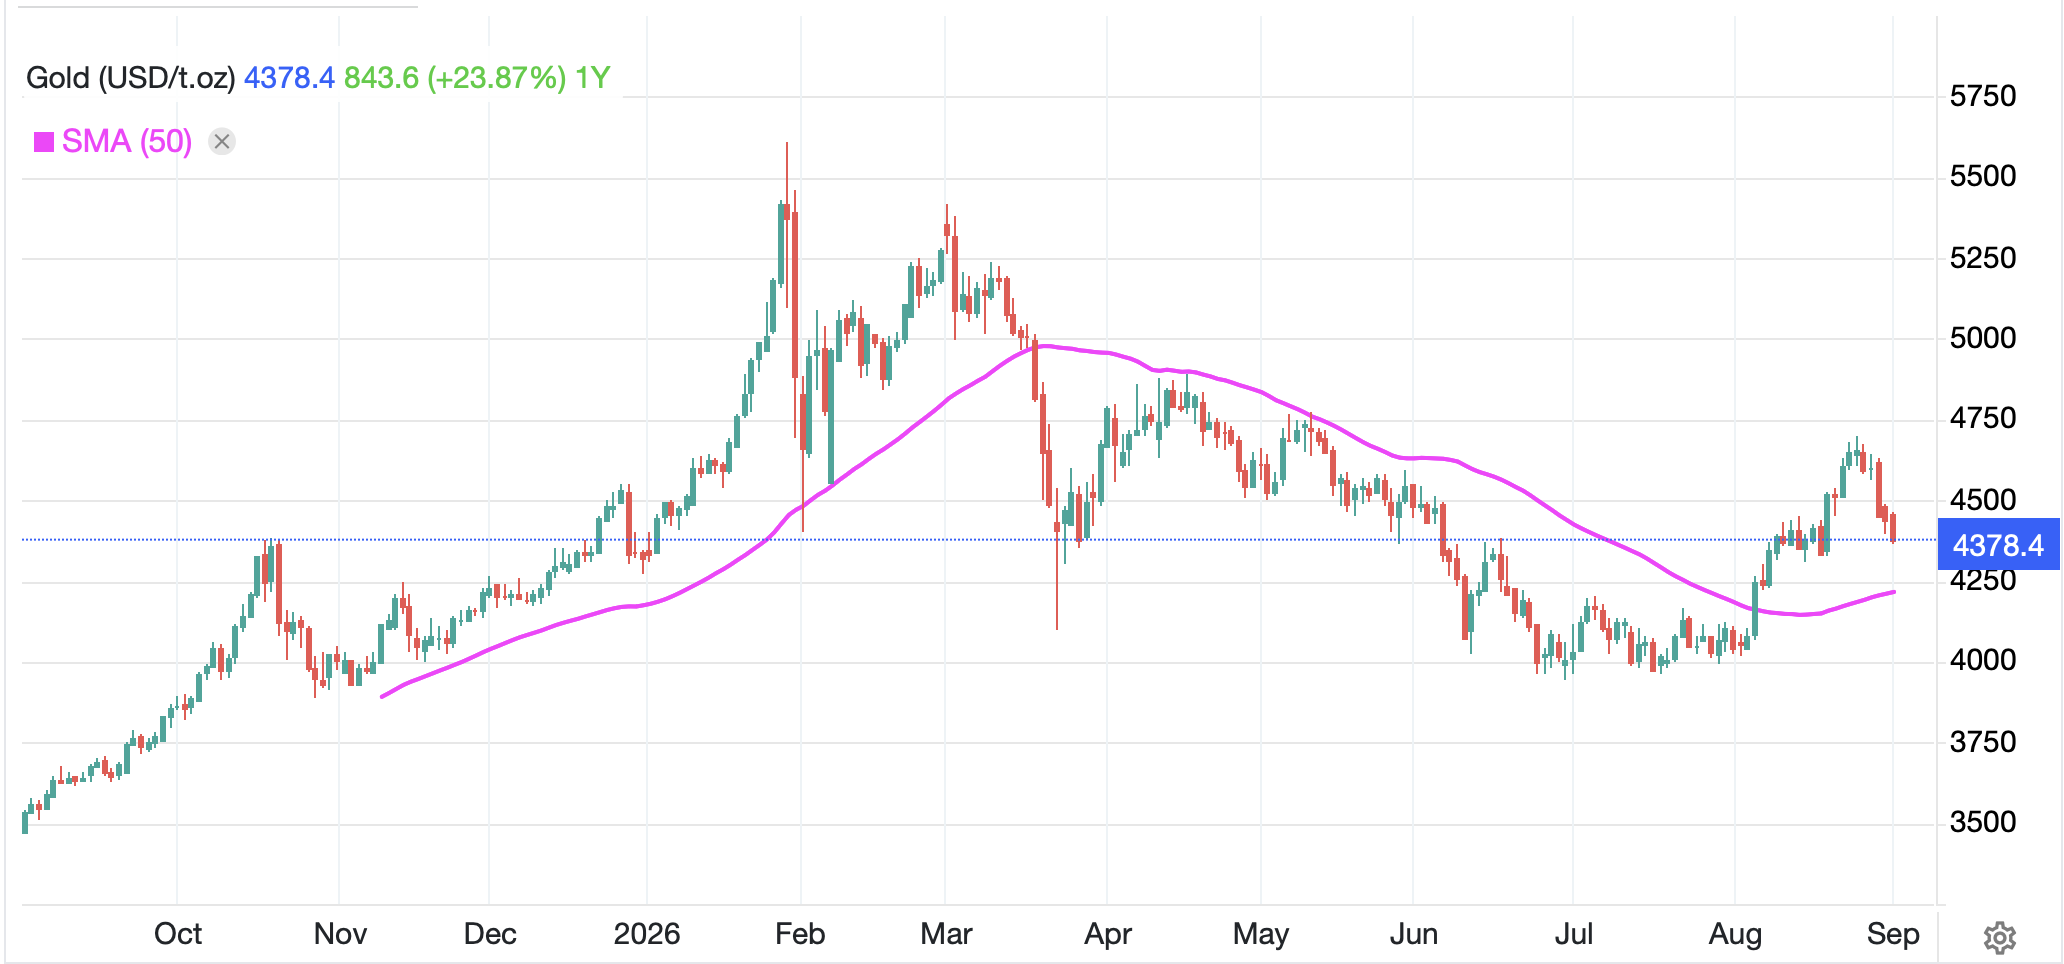
Which takes us back to the bond market and a few questions I have.  First an observation.  In the old days (Greenspan era) a rule of thumb in the bond market was the 10-year yield should approximate nominal GDP growth as a stable base.  I mention that because I am confused by the bond market reaction given the near universal view of Chairman Warsh’s speech on Friday was that he was hawkish and that rate hikes were coming.  But if that is the case, and the Fed is going to more aggressively address inflation, then why are bonds selling off?  Second, regarding the debasement trade, if bonds are selling off because of concerns over massive debt issuance and the assumed result that the dollar, and all currencies, are going to lose purchasing power, why is gold (-1.4%) selling off so aggressively?  It strikes me that gold should be flying higher on the view that inflation is going to rise, but then, I’m just a poet.  I guess one could make the technical argument that it is merely correcting its recent strong rally and it remains far above its 50-day moving average as per the below chart.

Source: tradingeconomics.com

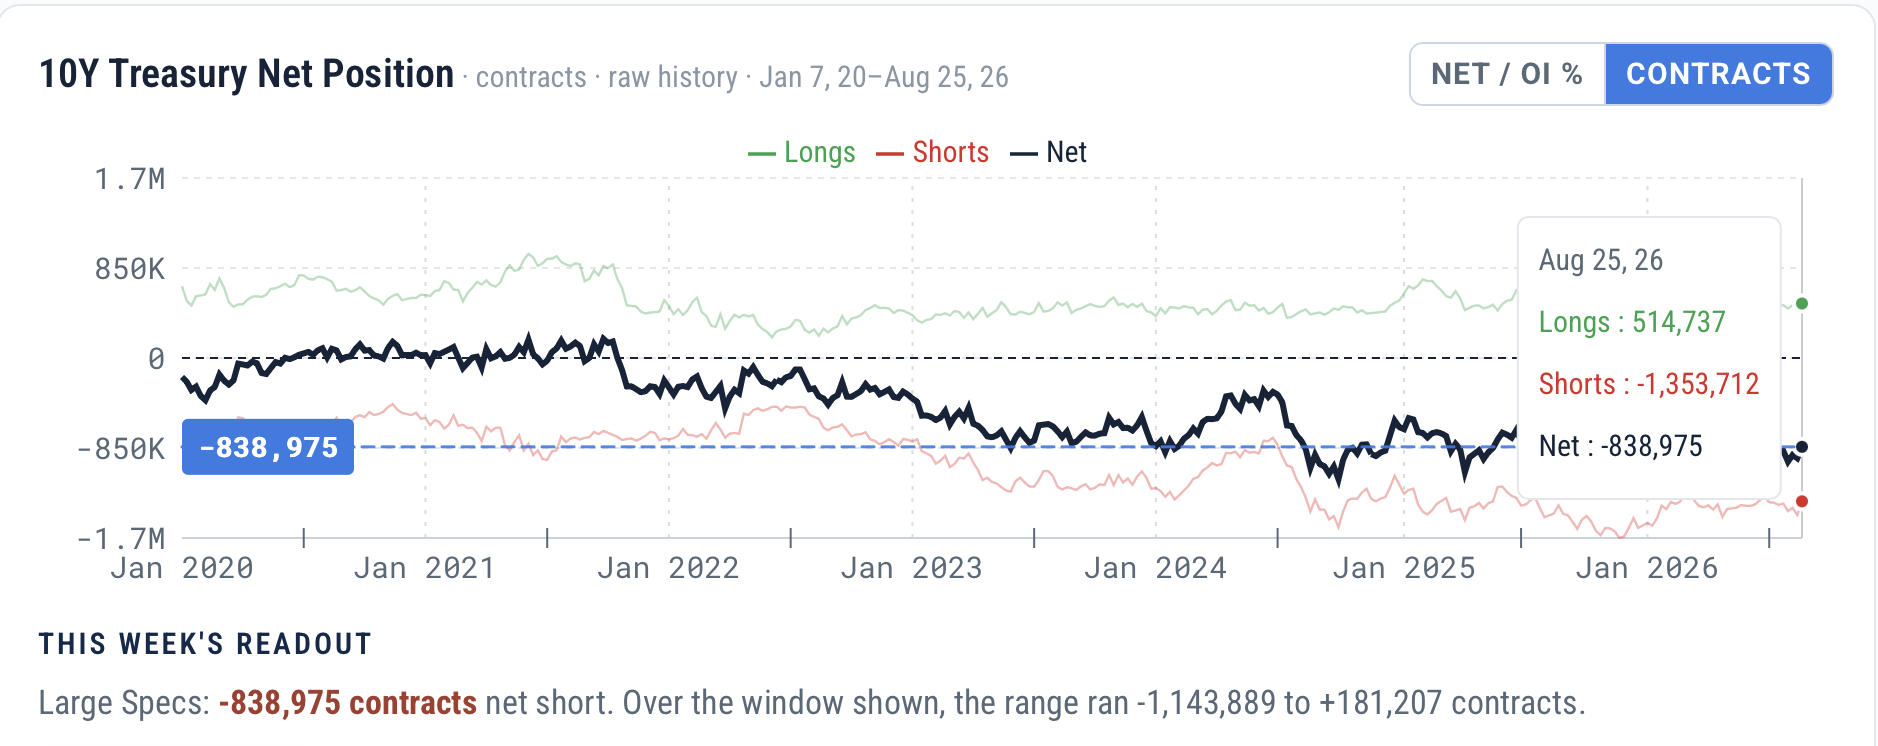
I wish I had the answers here, but I don’t.  However, something is amiss.  If the Fed was so hawkish, the bond market would not be aggressively selling off.  If the Fed was not hawkish, then the sell-off makes sense, but 90% of the punditry was wrong in their analysis of Warsh’s speech.  (My guess is they see that as a bigger problem.) One thing I do know, though, is that the bond market is quite bearish right now with nary a positive word to be found.  There is still a huge net short position in the bond futures market, as per the below chart.

Source: cotsignal.com

Here’s the thing about markets, at least in my experience.  Markets tend to seek out the ‘pain’ trade, the trade that will hurt the most participants most significantly.  As well, bull markets begin when all investors express uniform hatred of a product, like bonds right now.  Combining those two things leads me to believe that we could well be setting up for a significant bond market rally.  Just beware.

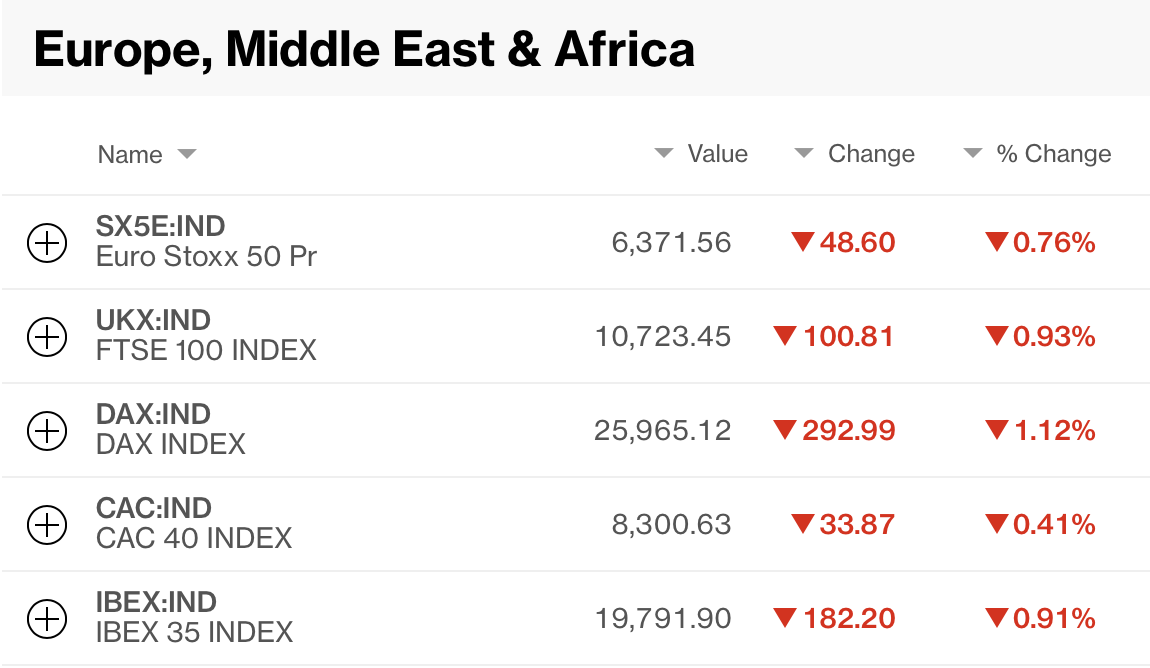
In the meantime, a quick tour of markets overnight shows negativity everywhere.  After yesterday’s declines in the US session, Asia saw mostly red numbers (Tokyo -0.15%, China -0.3%, HK -0.9%, Malaysia -1.5%, Singapore -0.8%) although Taiwan (+1.8%) and Korea (+0.25%) bucked the trend on some tech support which is also why the NASDAQ fell the least yesterday.  As to Europe, as you can see in the below screenshot from Bloomberg, it is universally red.

Lastly, US futures are under the gun this morning, down -0.5% except for the NASDAQ which is reversing yesterday’s outperformance and lower by -1.3% at this hour (7:20)

We’ve already discussed bonds, but this Bloomberg screenshot is worthwhile, I think.

Of course, the outlier here is the UK, which was closed yesterday so had a lot of catching up (down?) to do.

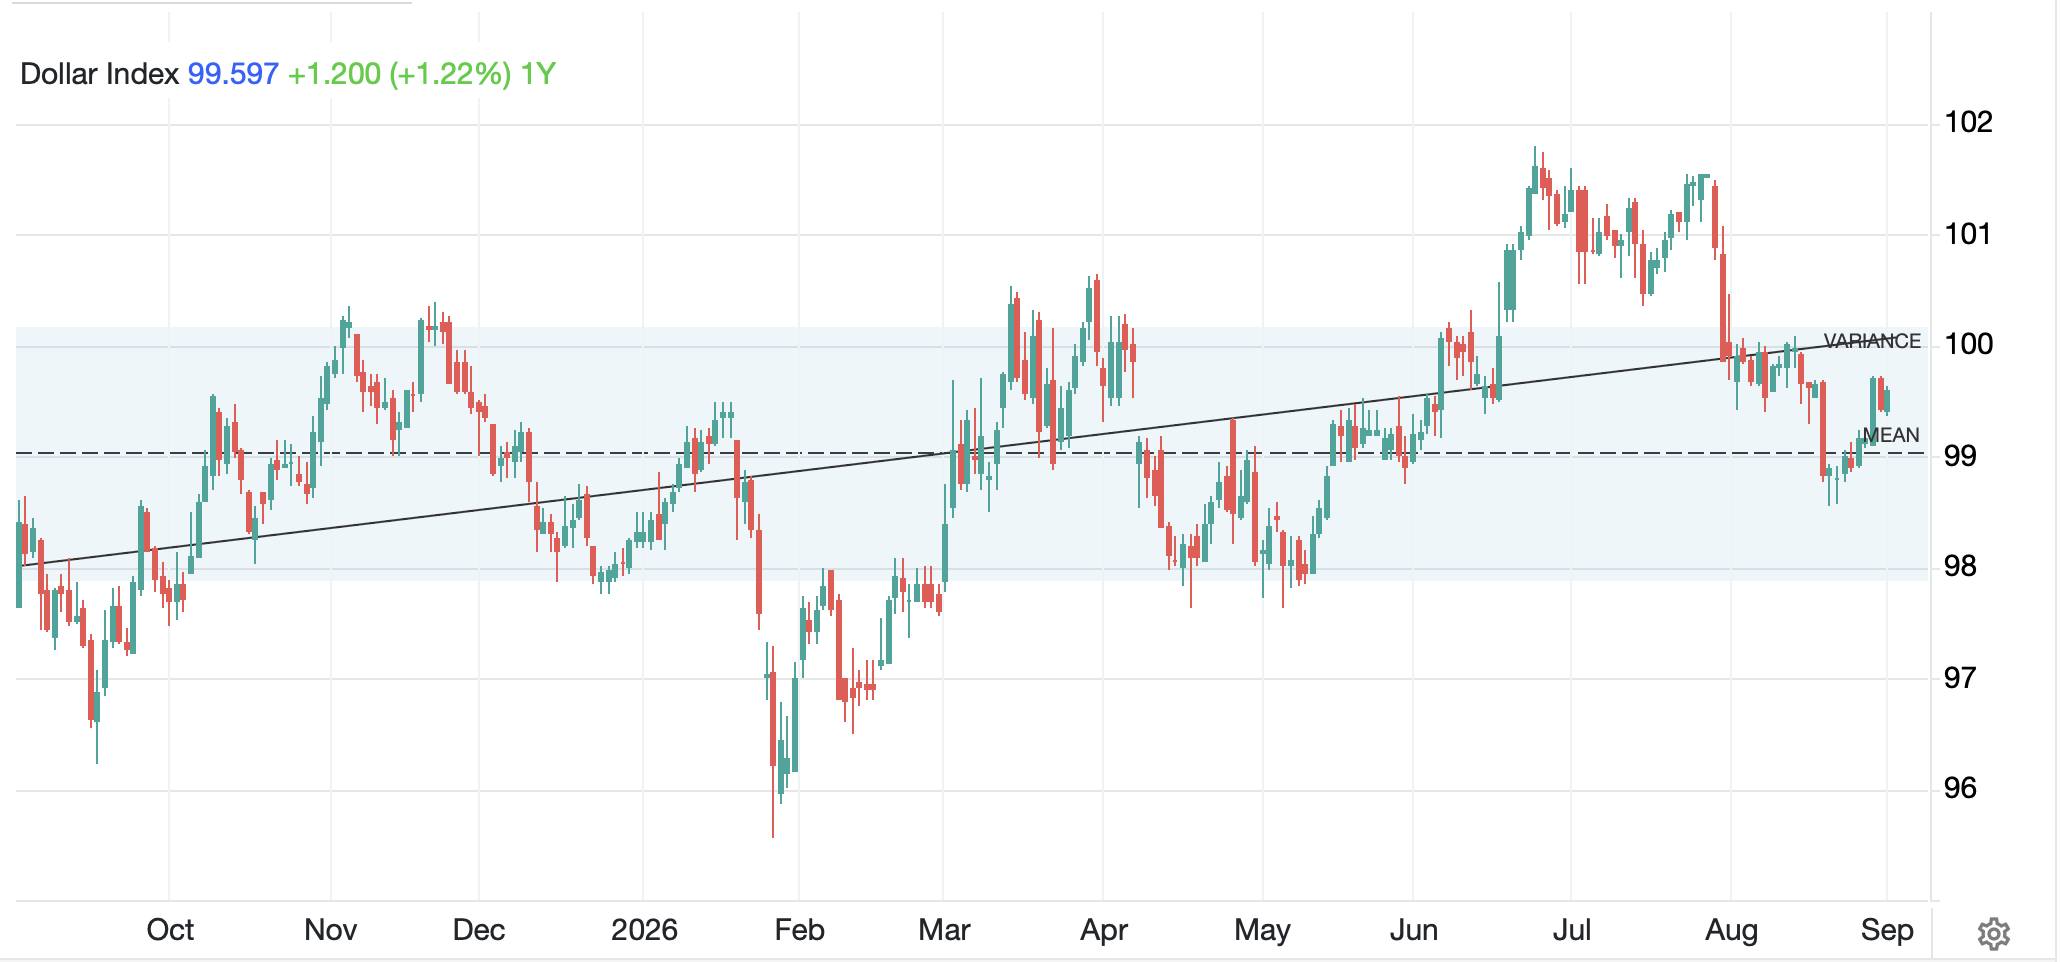
We’ve already discussed commodities which brings us to the dollar, which is rising despite yields rising everywhere.  Now, the DXY is at 99.60, hardly new territory although the trend over the past year is marginally higher as per the below chart.

Source: tradingeconomics.com

If we look at individual currencies, JPY (-0.2%) has seen the dollar rise back above 160 as the post intervention price action remains consistent with every previous effort.  Perhaps the most surprising outcome today is ZAR (-0.1%) which is holding up quite well despite much higher oil prices and much weaker gold prices, the two key issues in that economy.  But net, as much as people worry about the debasement of the dollar, it appears they are more worried about the debasement of other currencies more rapidly.

On the data front, this morning brings ISM Manufacturing (exp 55.2) and Prices Paid (72.0) as well as the JOLTs Job Openings report (7.3M). Fed Governor Barr speaks before the data at 9:00 this morning so I wonder if he will reaffirm the hawkish vibe, and if he does, shouldn’t that help the bond market?  I am still focused on Friday’s NFP as the next truly important piece of news, but there is an awful lot that can happen between now and then, especially with this President.

Good luck

Adf