On Monday, an analyst wrote
His thoughts how AI might promote
A future, dystopic
Though somewhat myopic
And offering no antidote
Although prior views had explained
That once AI’s suitably trained
Most labor would suffer
And lacking a buffer
Folks’ politics would be quite strained
This is the research report that got tongues wagging on Wall Street yesterday and the fear it allegedly engendered was impressive. In essence, it said that by 2028, AI would replace vast swaths of the labor force, notably white-collar workers, and that it would lead to a massive recession, and more importantly to the Street, a significant decline in stock prices. The back and forth on X was amusing all day as there were those who hyperventilated over the coming tragedy, and those who fought back.
It is important to understand this was not a prediction, per se, but one of the scenarios they came up with, although clearly the most dramatic one. It certainly gained a lot of clicks and notoriety, and let’s face it, isn’t that the idea these days?
Given that the tariff story has now become too complex for anyone to truly understand, and while we all await the denouement in Iran, this appeared to be the best thing to occupy time amongst the trading community. Personally, I spent the entire morning shoveling snow, but then, I’m no longer a trader.
The upshot is that the major indices all fell more than 1% while gold and silver rallied and bond yields fell. Fear was palpable. But will it last?
Last month’s yen rate checks
Came not from Ueda-san
But Bessent, himself
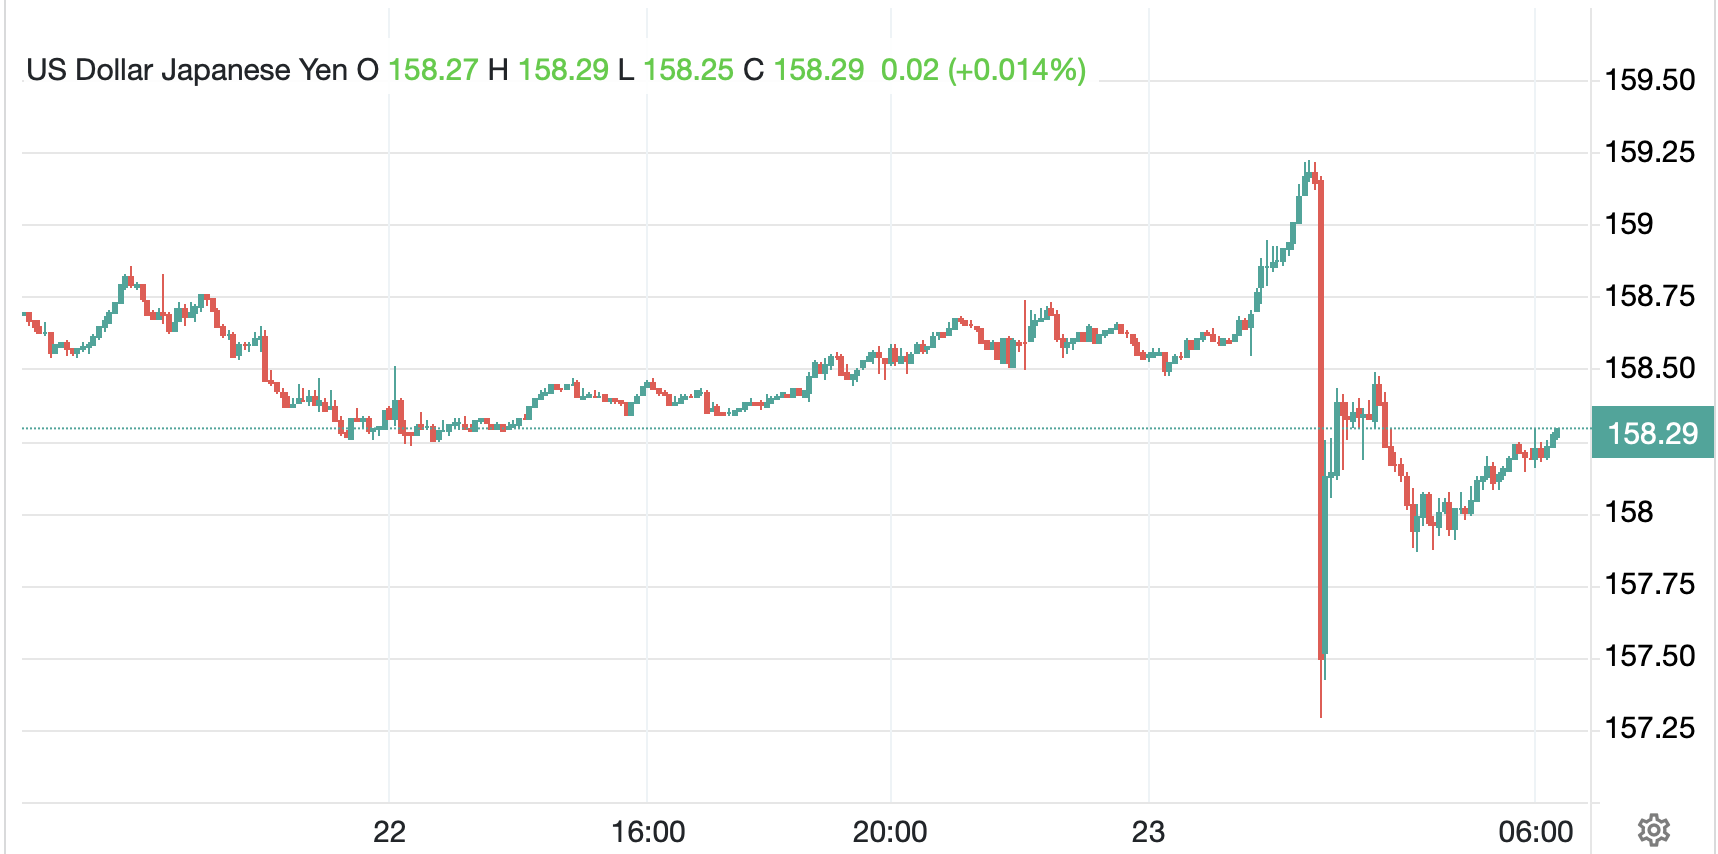
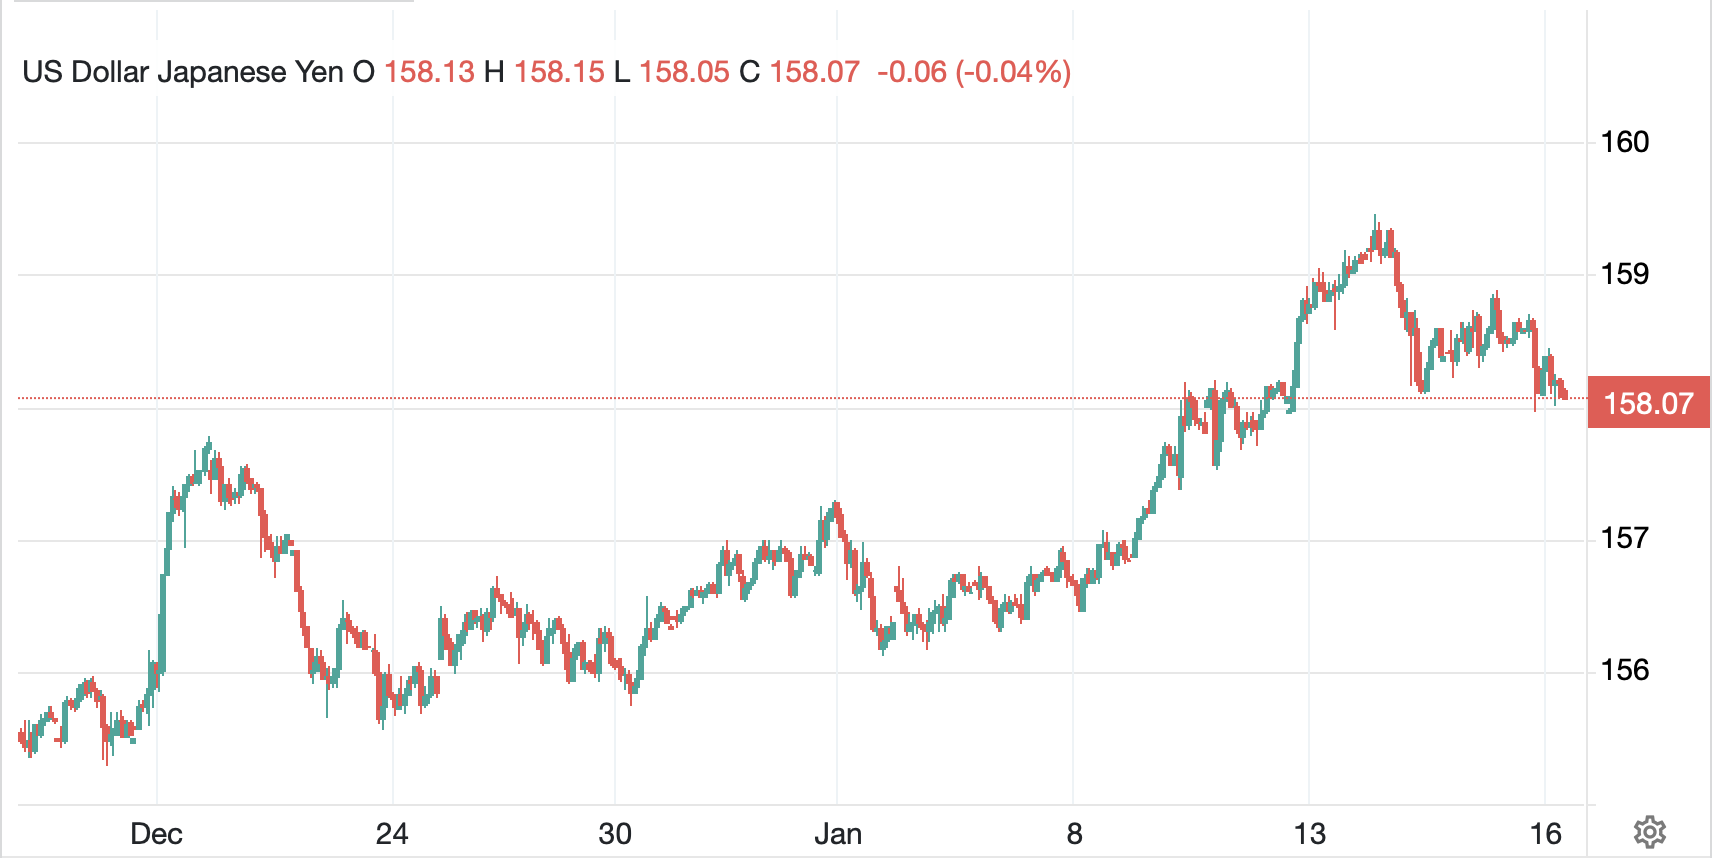
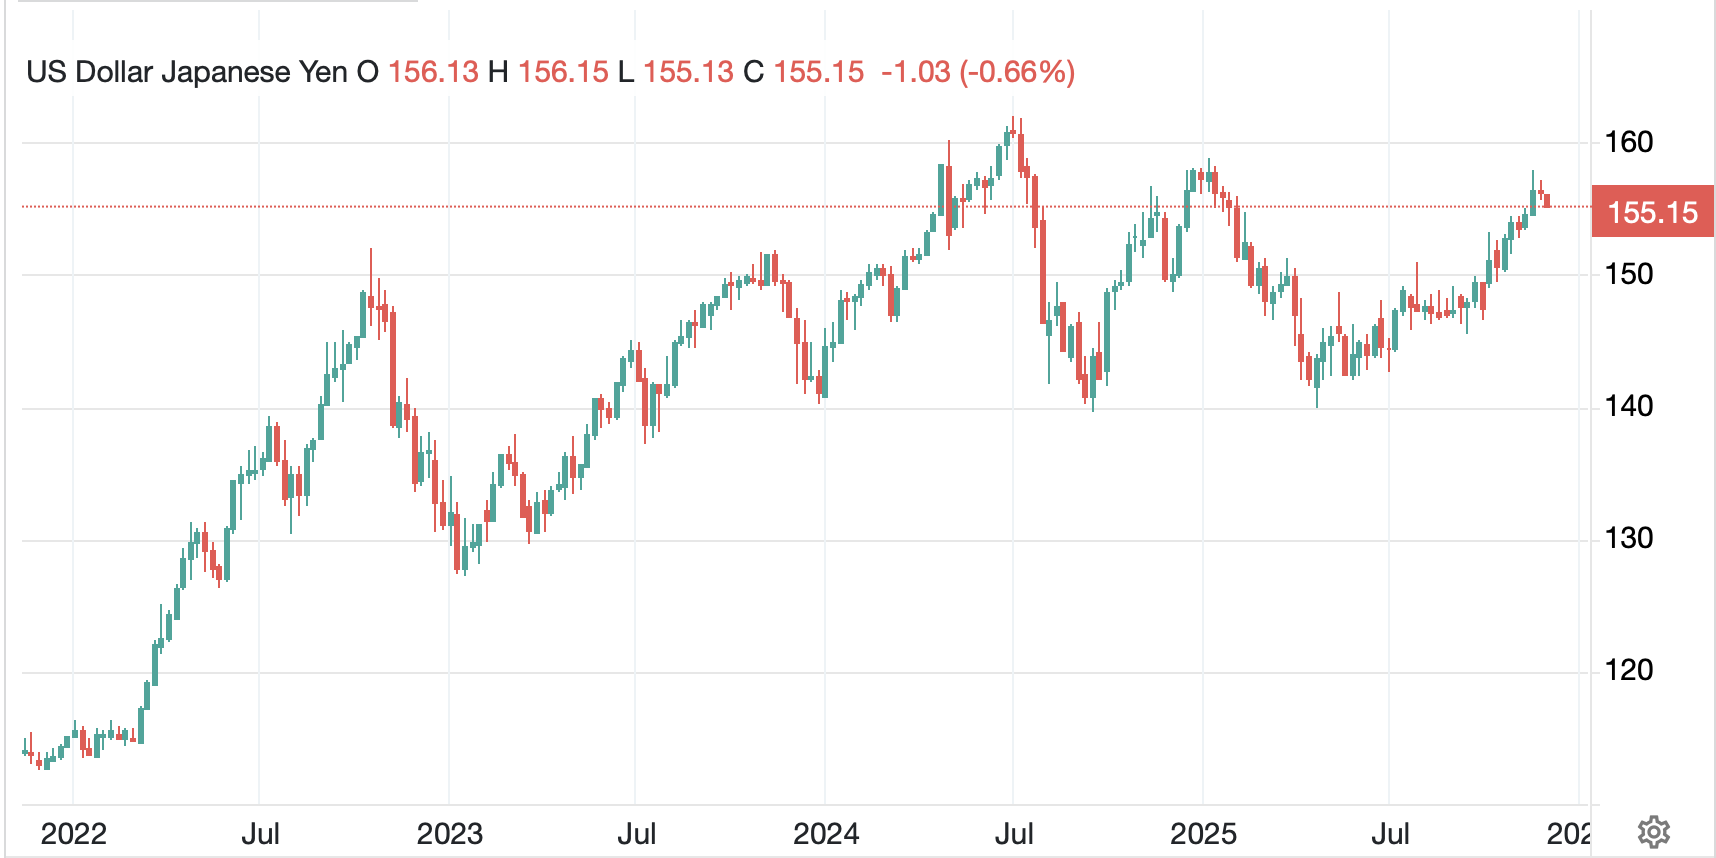
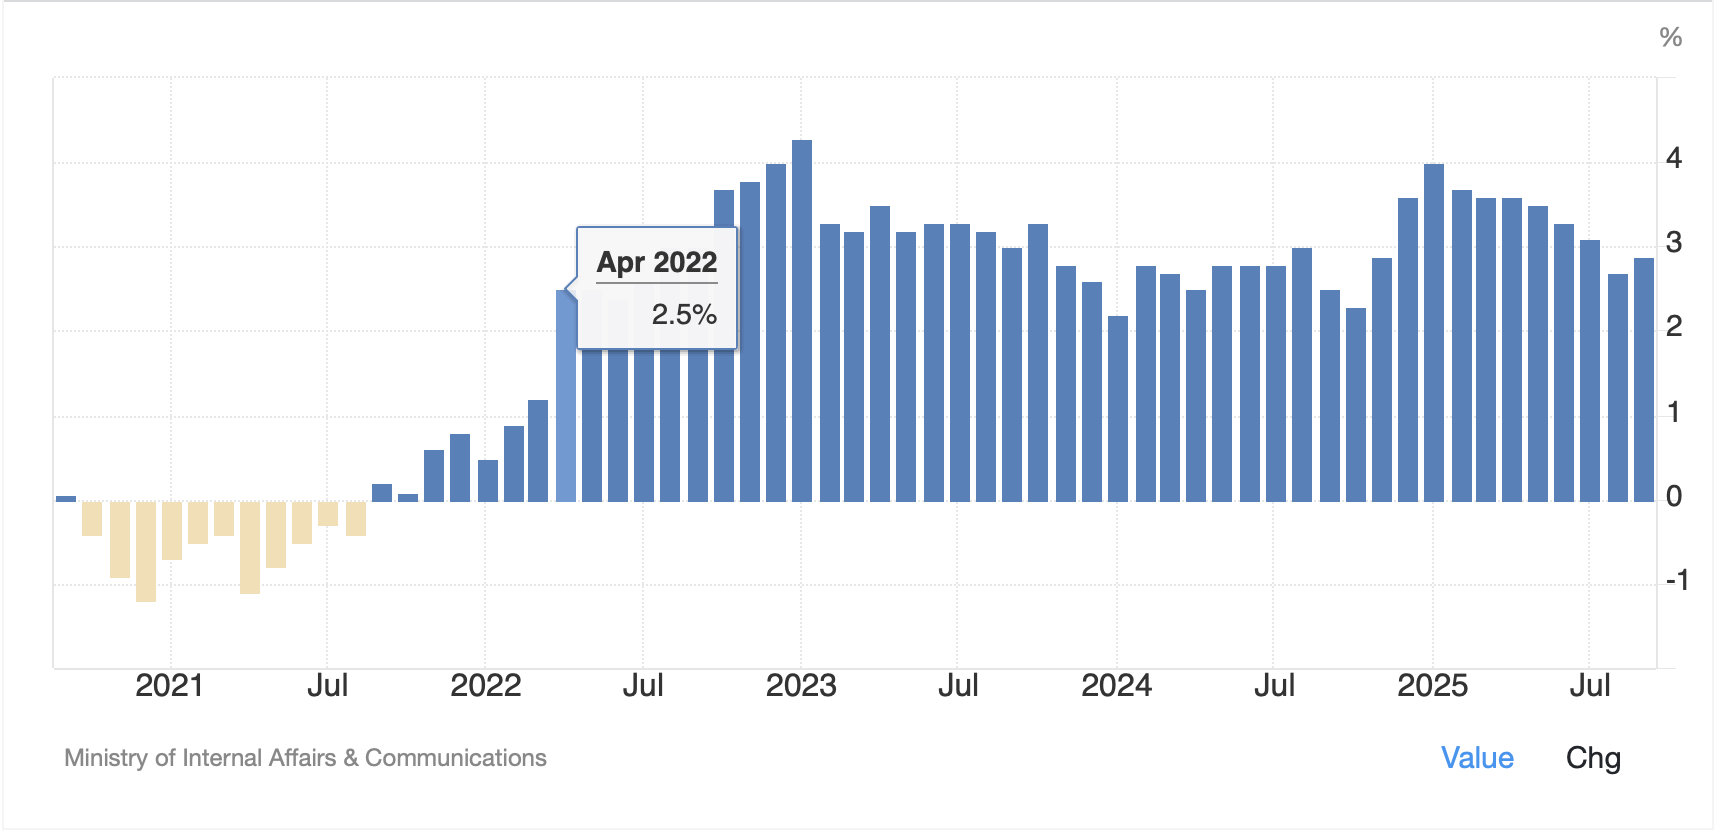
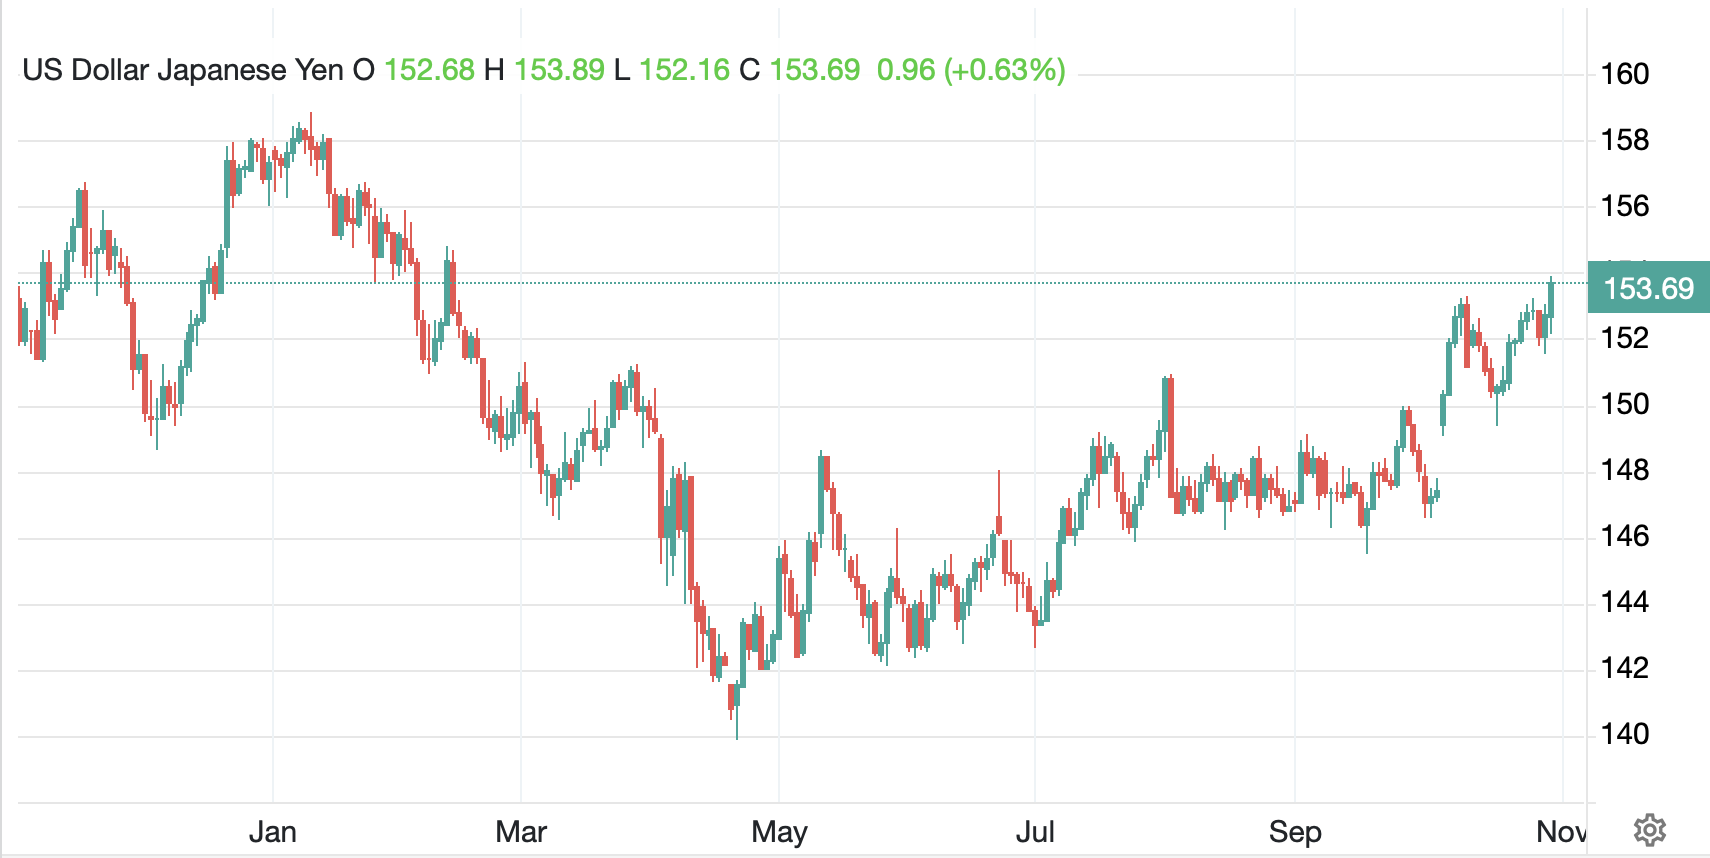
The other story of note was almost an aside, although it helps outline recent movement in USDJPY. We all remember last month when the yen rallied very sharply during a Friday session in NY as word got out the Fed was “checking rates”. As a reminder, this is when the Fed calls out to bank FX desks and asks for prices, although doesn’t actually deal. However, the signal is strong as all the banks recognize the opportunity for intervention, and the news quickly spreads through the market with the effect you can see in the chart below. During the next three sessions, the yen rallied 4.5%.
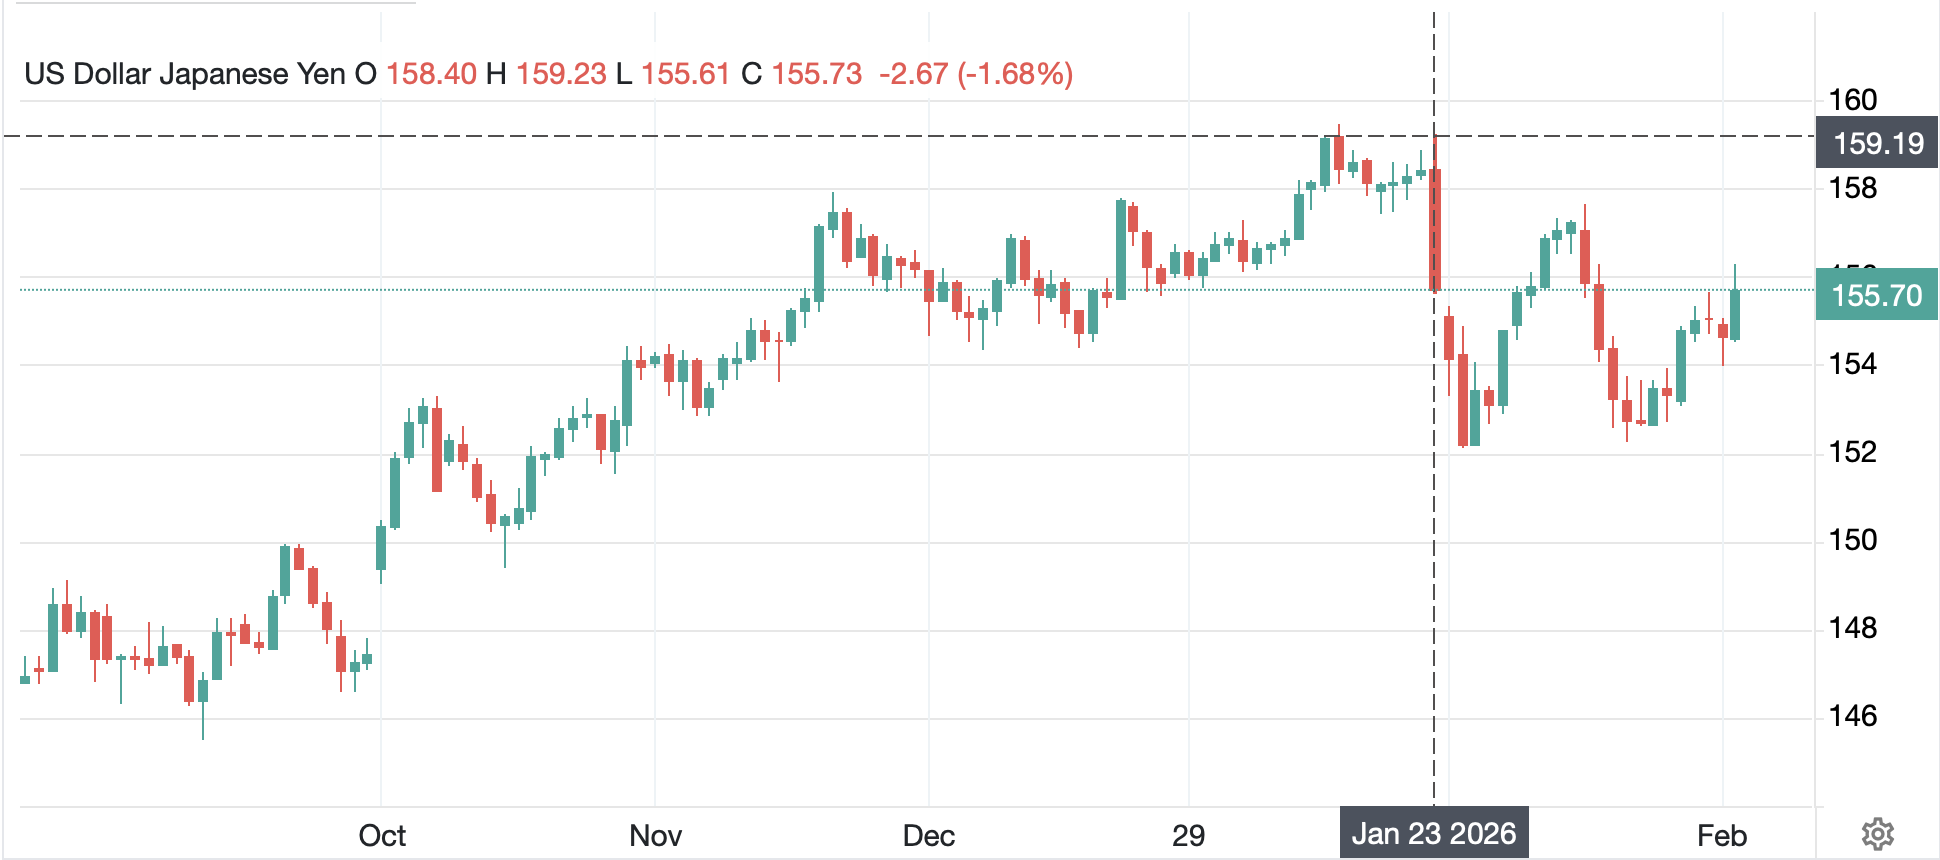
Source: tradingeconomics.com
During my career, I had never heard of this activity driven by anyone other than the BOJ, as they were always the most concerned with the yen’s value. Certainly, they may have been responding to US pressure, but it was always their call. Now the news comes out that Treasury Secretary Bessent did this on his own last month, a clear indication that the administration is not happy with an over weak yen. This sets an interesting precedent regarding who controls any given currency. Now, I doubt we will see this type of thing frequently, but we need to keep it in the back of our mind. Meanwhile…
Seems Takaichi
Told Ueda, higher rates
Are not helping her
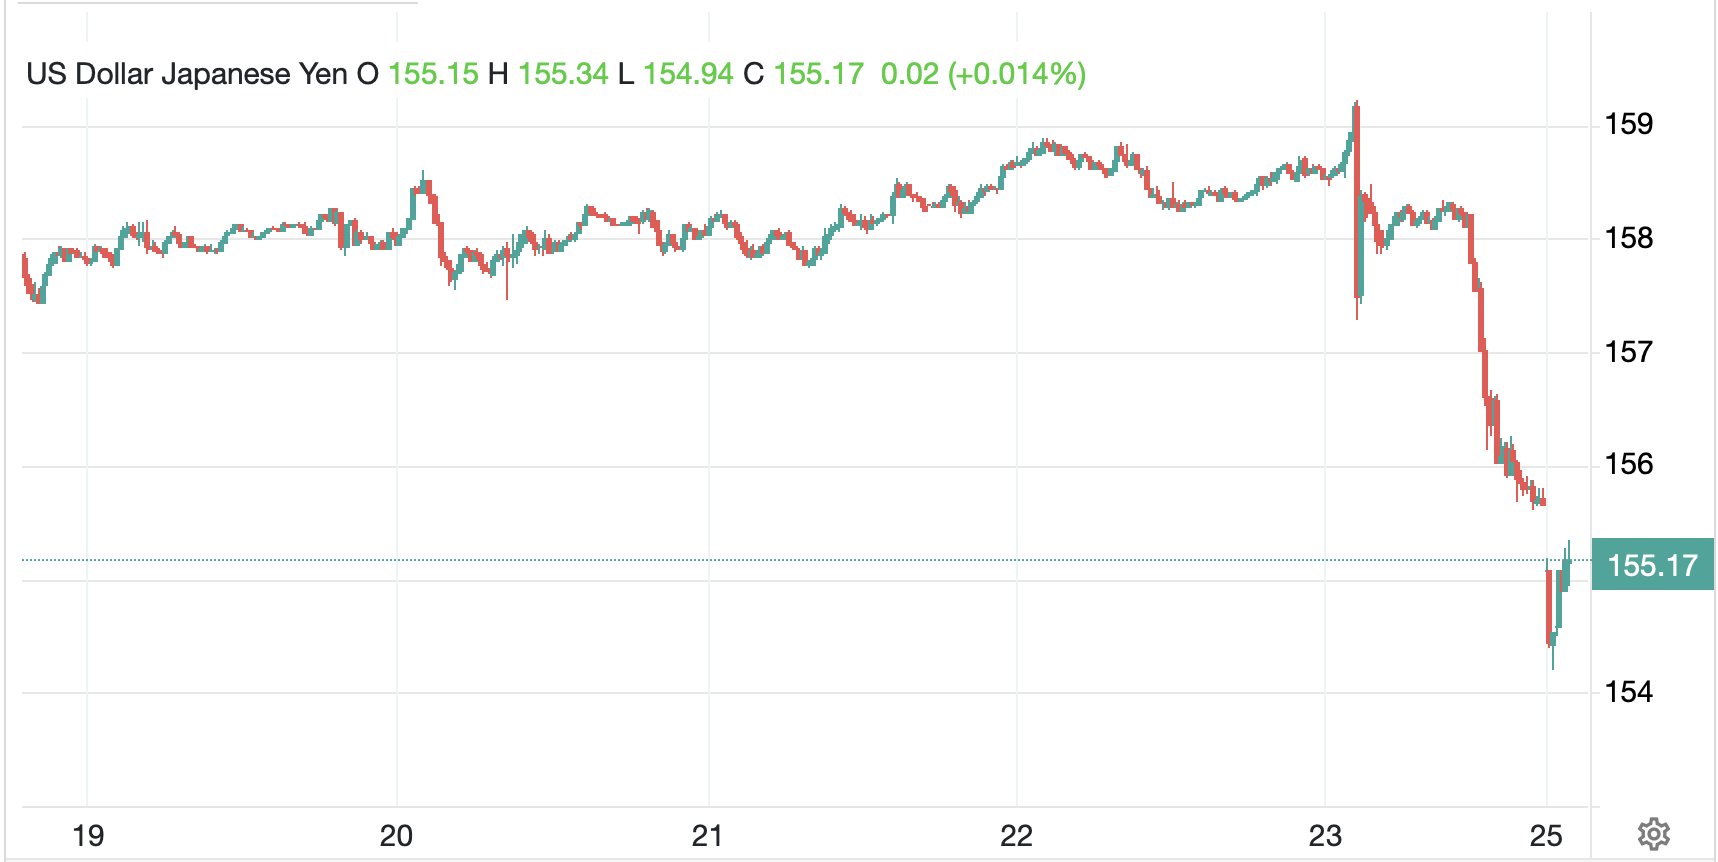
Last night, in a surprise to many in the market, news of a meeting between PM Takaichi and BOJ Governor Ueda resulted in Takaichi-san imploring Ueda-san to leave rates alone, rather than continue raising them. Higher rates are not helping her growth agenda, and I imagine her belief set is that if the yen weakens too far, she can always intervene, and now that we know about Bessent’s actions, she can count on the US to help. But I cannot observe this and think anything other than the market is going to test 160 and do so before long. One poet’s opinion.
Ok, let’s see how markets traded overnight. First off, last night was the first that all of Asia was back at work so overall liquidity was improved. However, the results were mixed with Tokyo (+0.9%) ignoring the AI driven US rout while the Hang Seng (-1.8%) fell right alongside the US. China (+1.0%) rallied in its first day back but consider that simply offset the decline of their last session and, like most other markets, it remains relatively unchanged over the period. Meanwhile, the tech sense was strong with Korea (+2.1%) and Taiwan (+2.75%) both up nicely while India (-1.3%) suffered under the AI fear umbrella. Elsewhere in the region, there was no pattern of note with both gainers and losers.
In Europe, the largest markets (UK, Germany and France) are basically unchanged this morning while both Spain (-0.7%) and Italy (-0.4%) are under some pressure. There is talk of tariff issues, but I’m not sure why only those two markets are taking the heat. As to the US, at this hour (7:00), all three major indices are higher by about 0.2%.
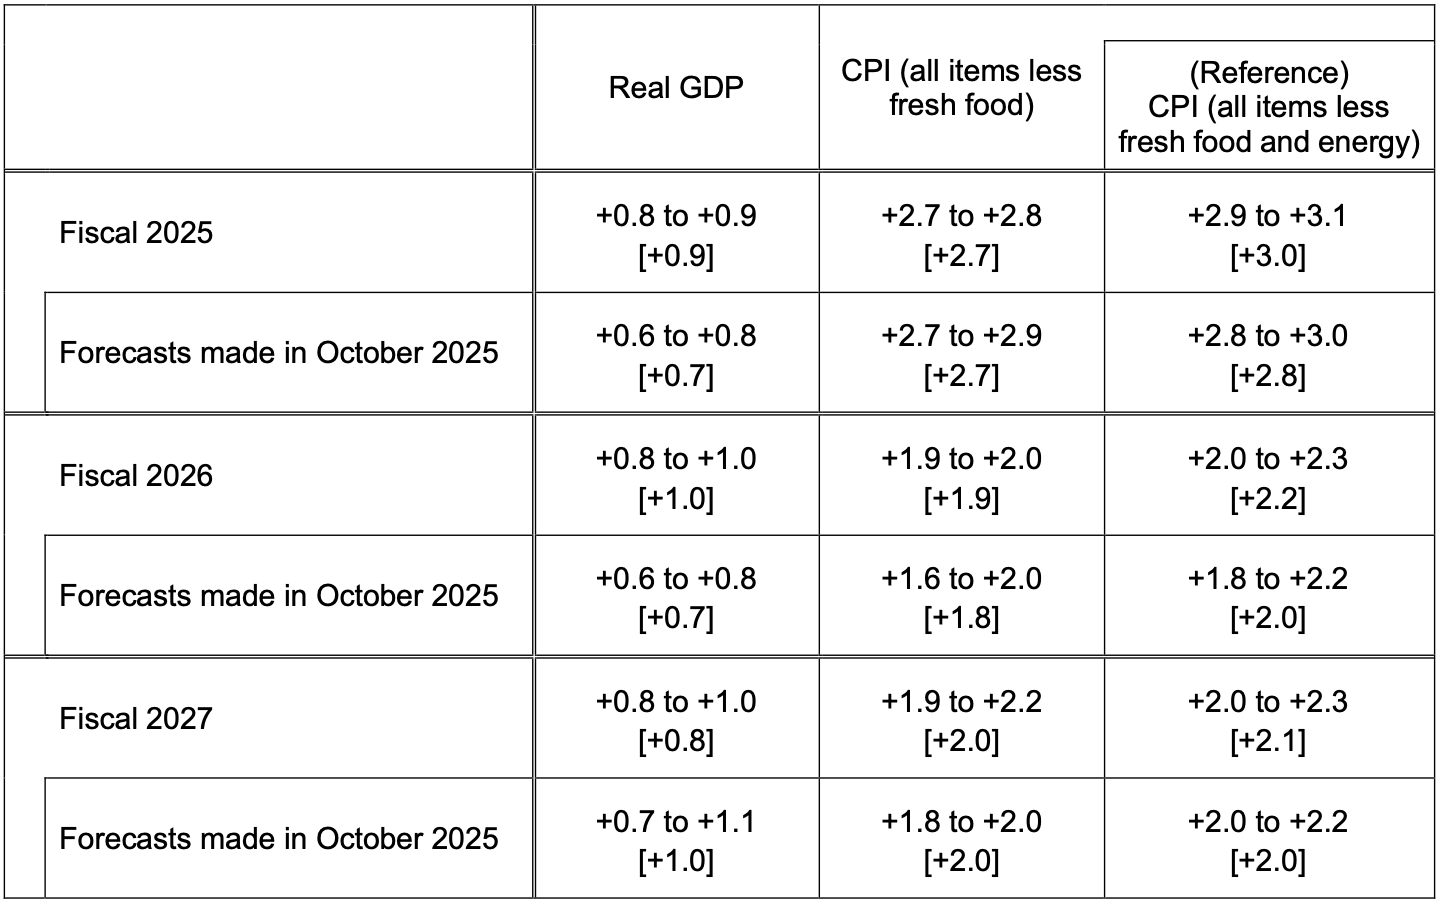
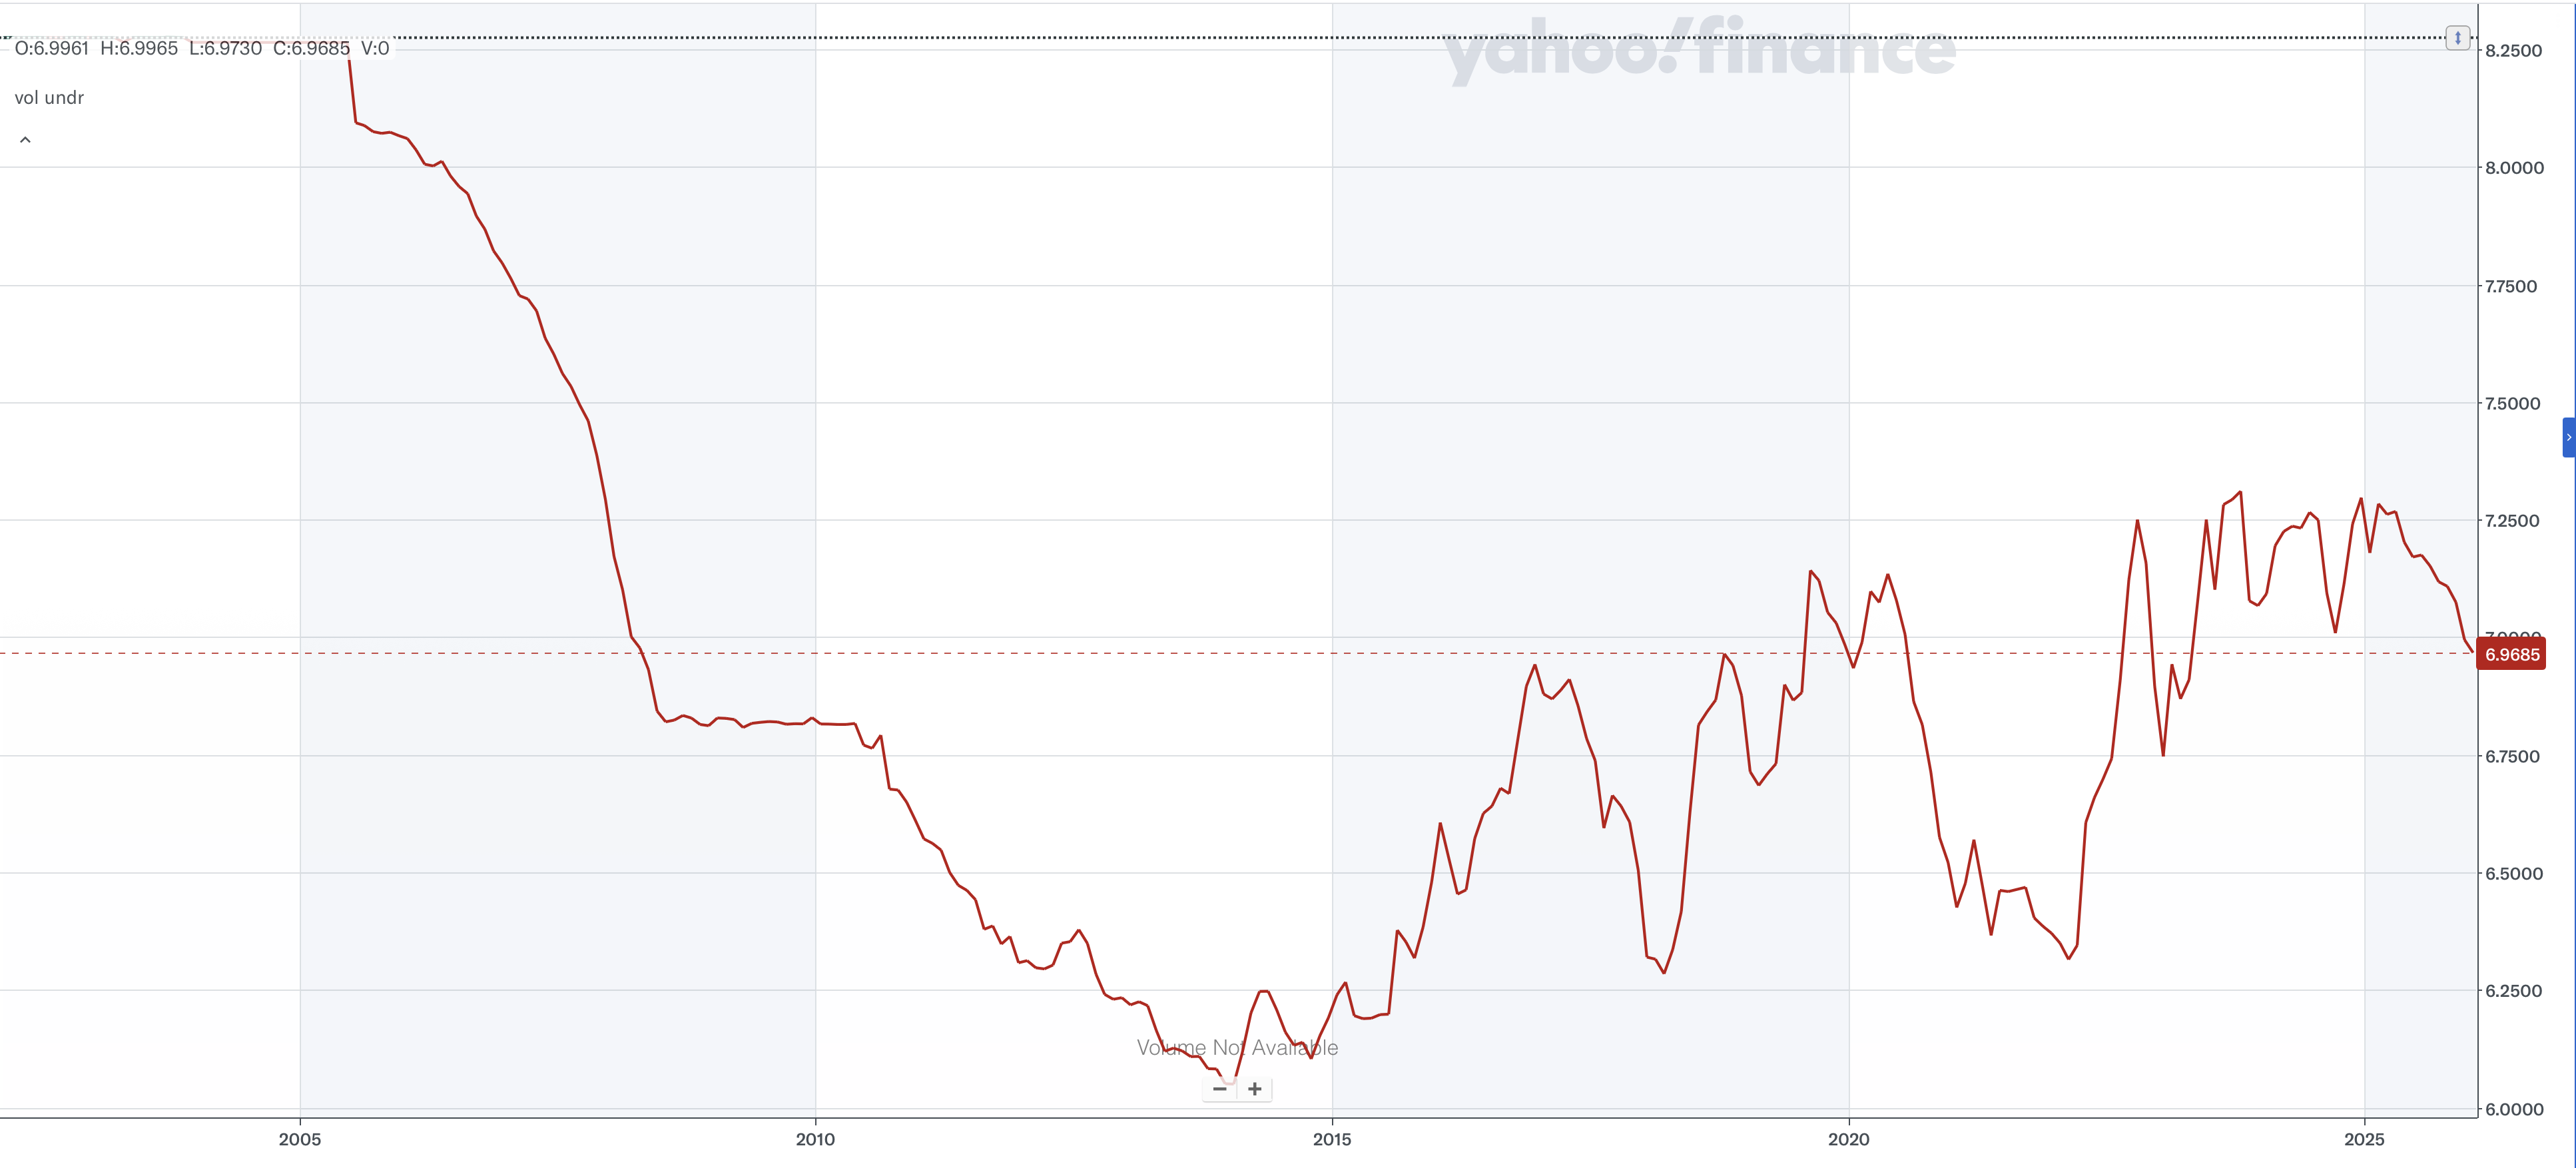
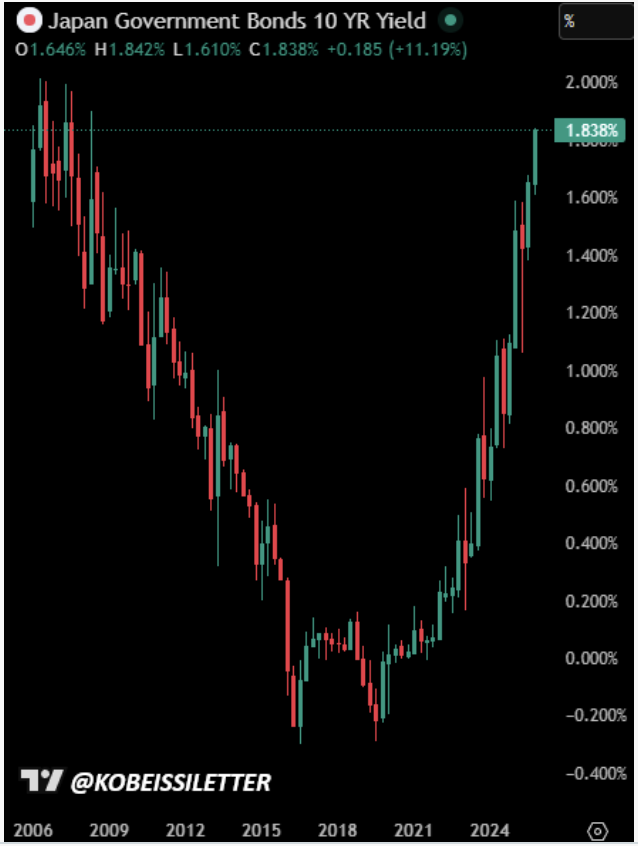
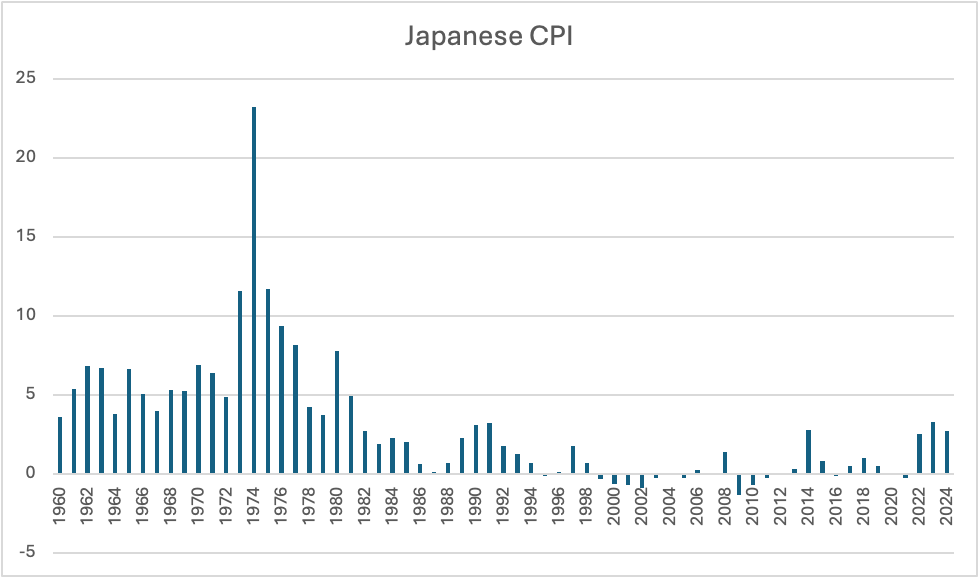
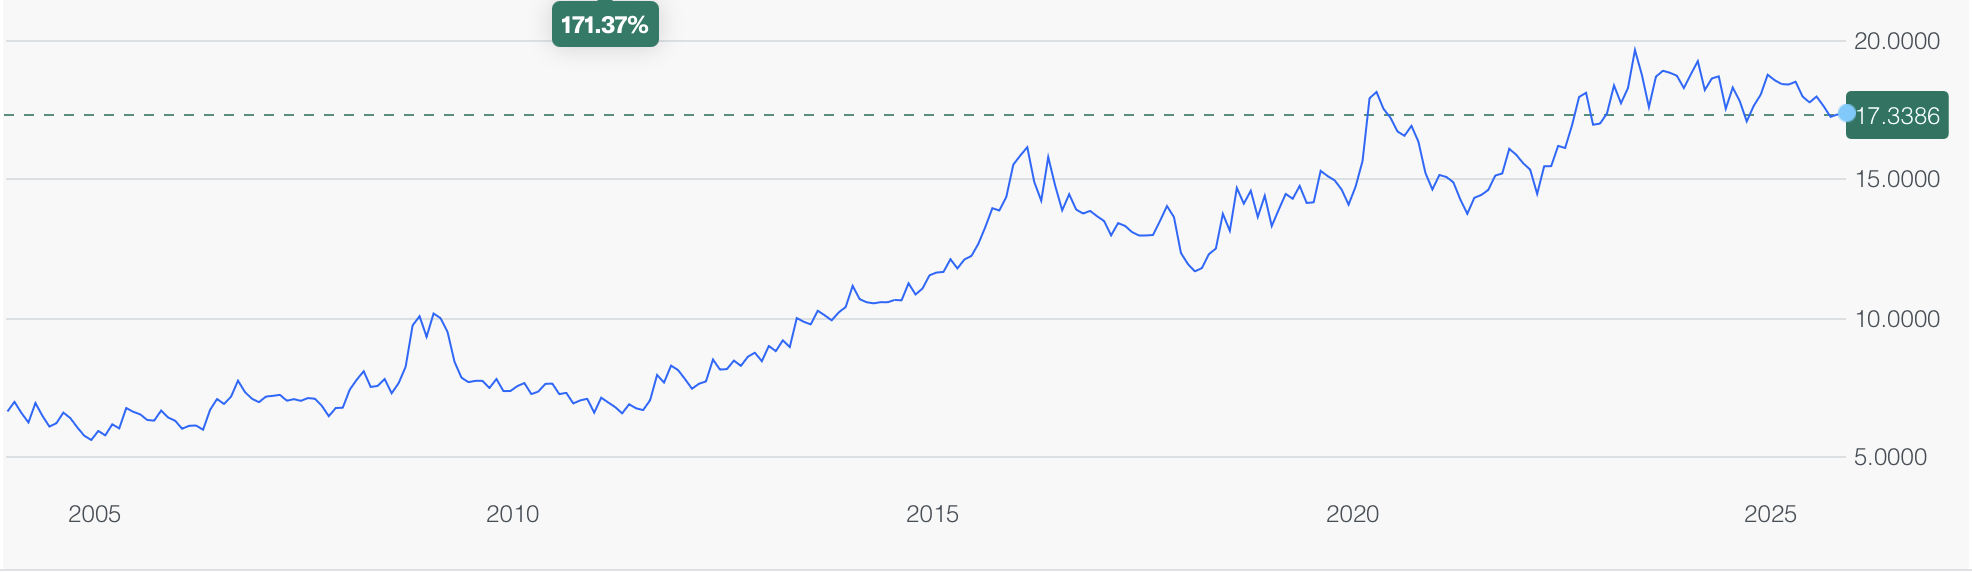
In the bond market, after a -4bp decline in Treasury yields yesterday they are unchanged this morning while European sovereigns are seeing yields slip -1bp across the board. Too, JGB yields (-2bps) have continued their slow descent as it appears investors have acclimatized to the risks of Takaichi-nomics. I think we will have to see inflation figures there to get a better sense. Regarding Treasury yields, I’m not sure I can explain why I feel this way, but given how bearish sentiment is for bonds, (leveraged players are short >1 million futures contracts), it feels to me like we could see a short-term continuation of the recent rally with yields heading back to test the 3.8% level at least. I understand both the fiscal argument and the technical argument (see long-term chart below) but neither rules out a short-term rally to inflict pain. After all, that is what markets do best! (full transparency, I bought some June TLT call spreads yesterday, so I am talking my book!)
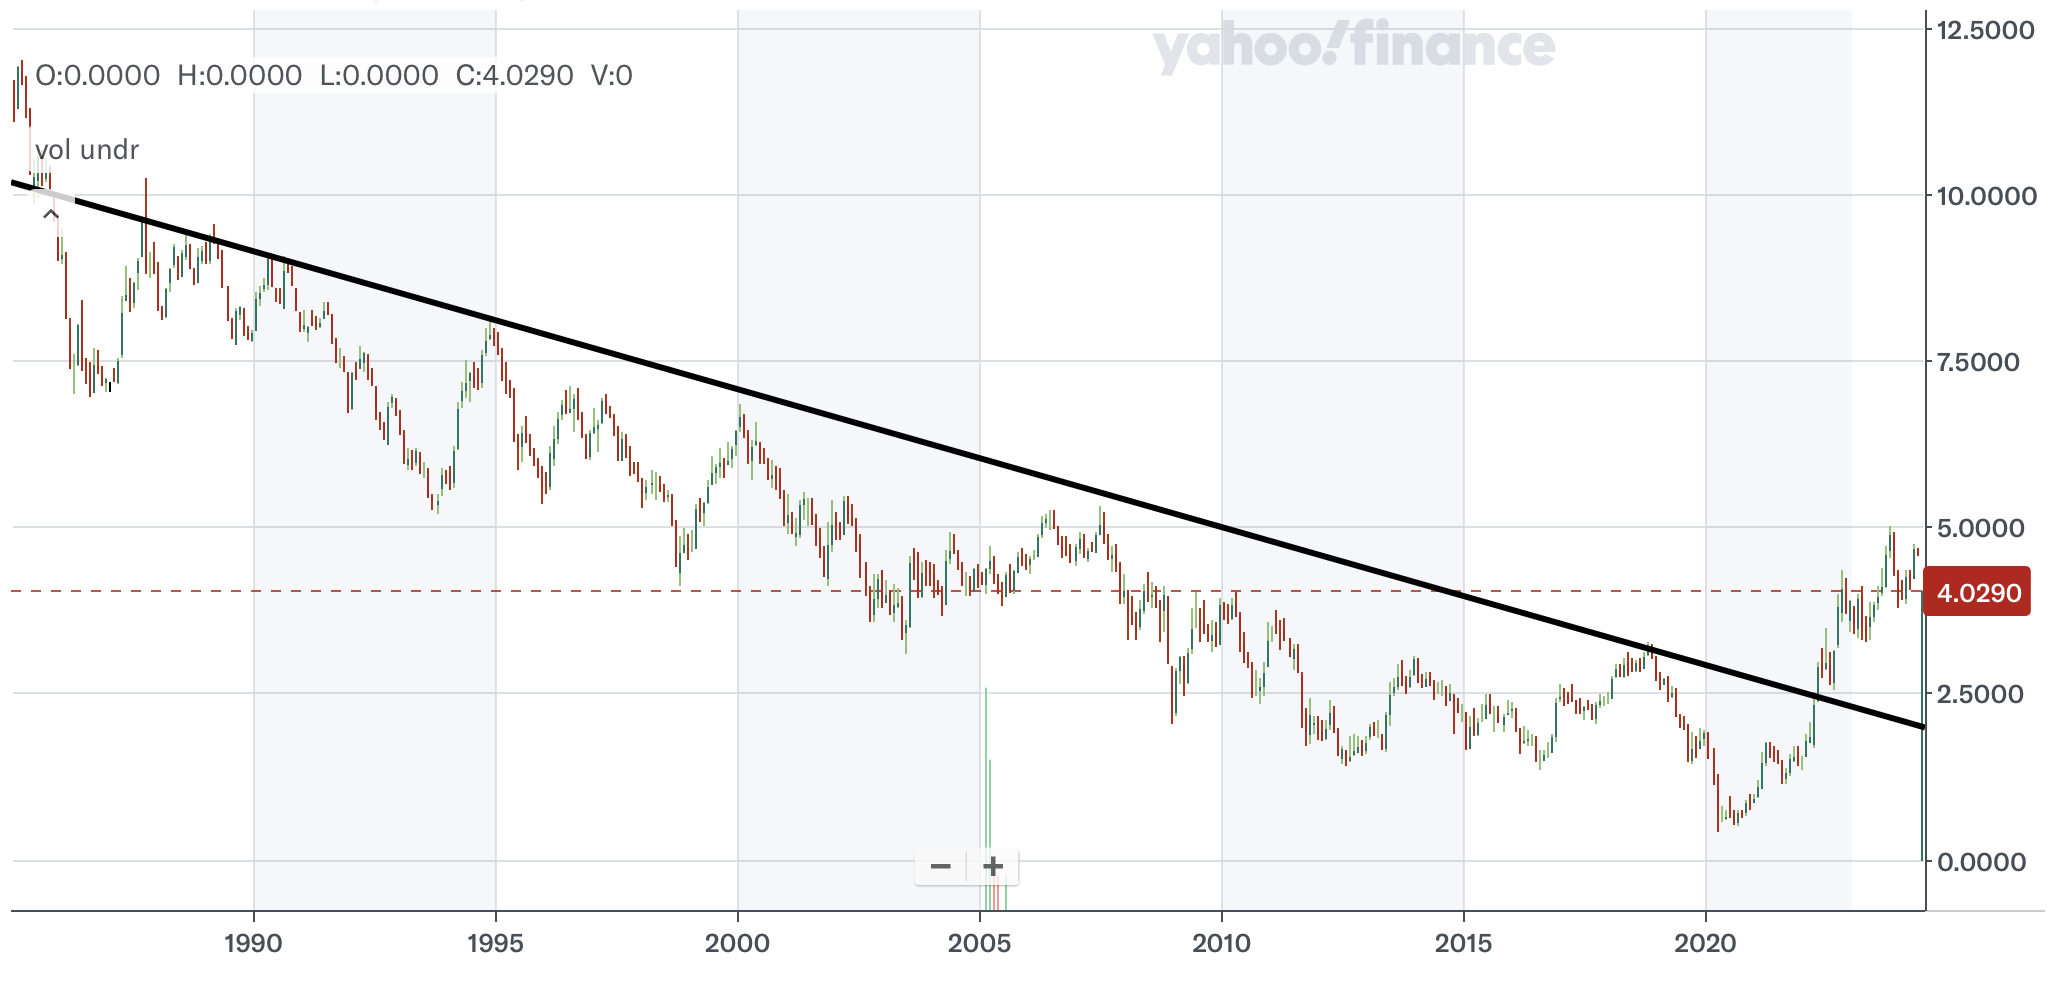
Source: finance.yahoo.com
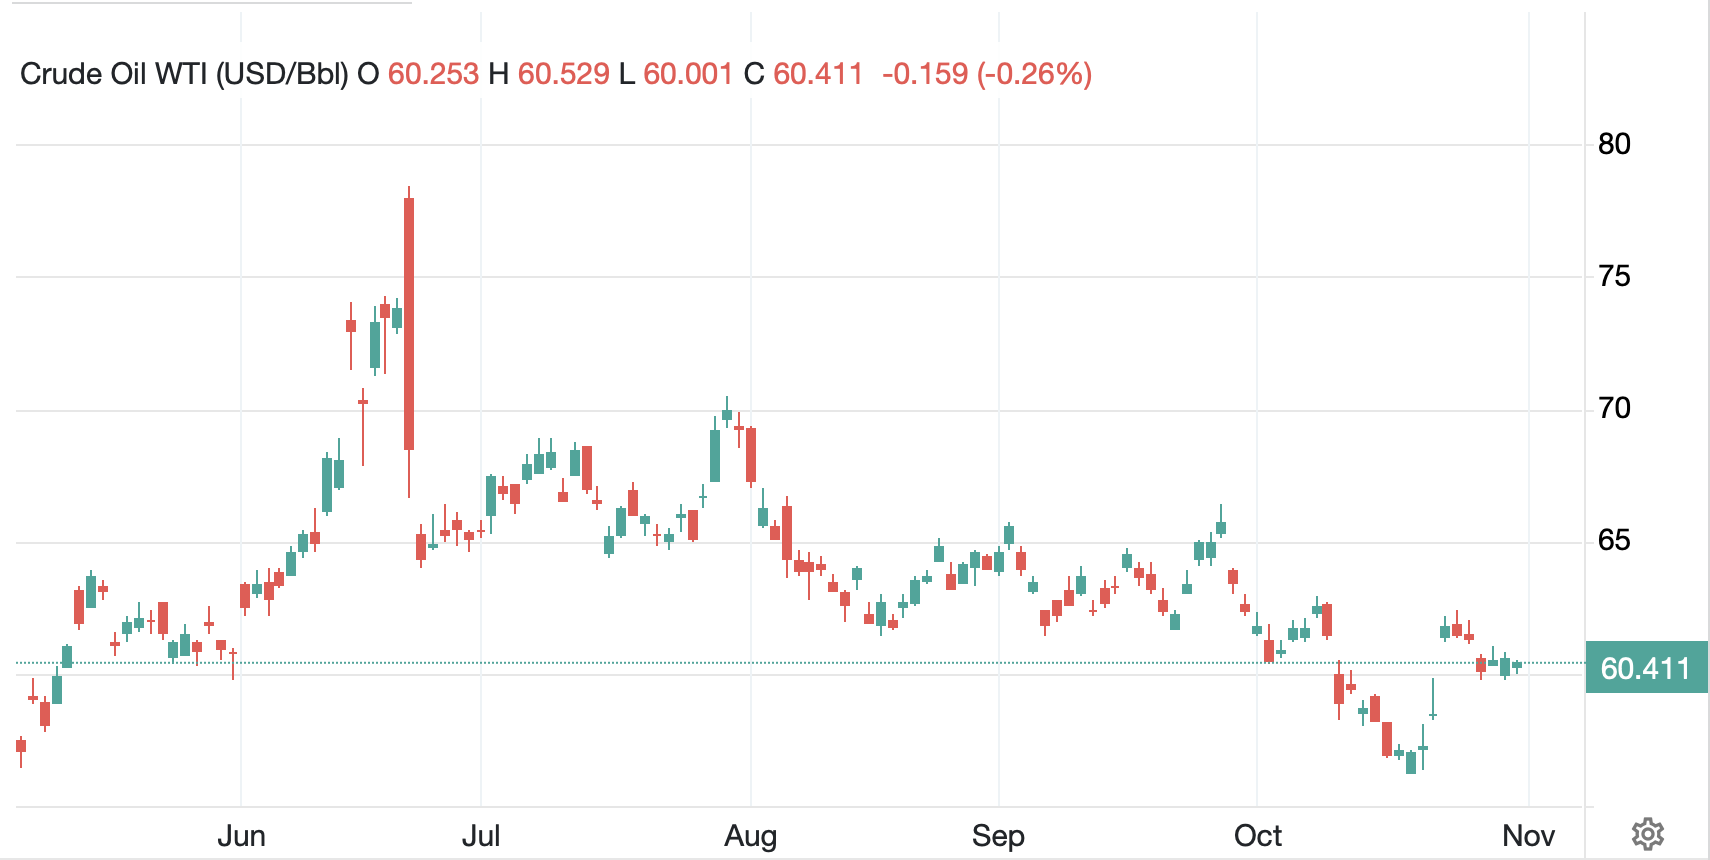
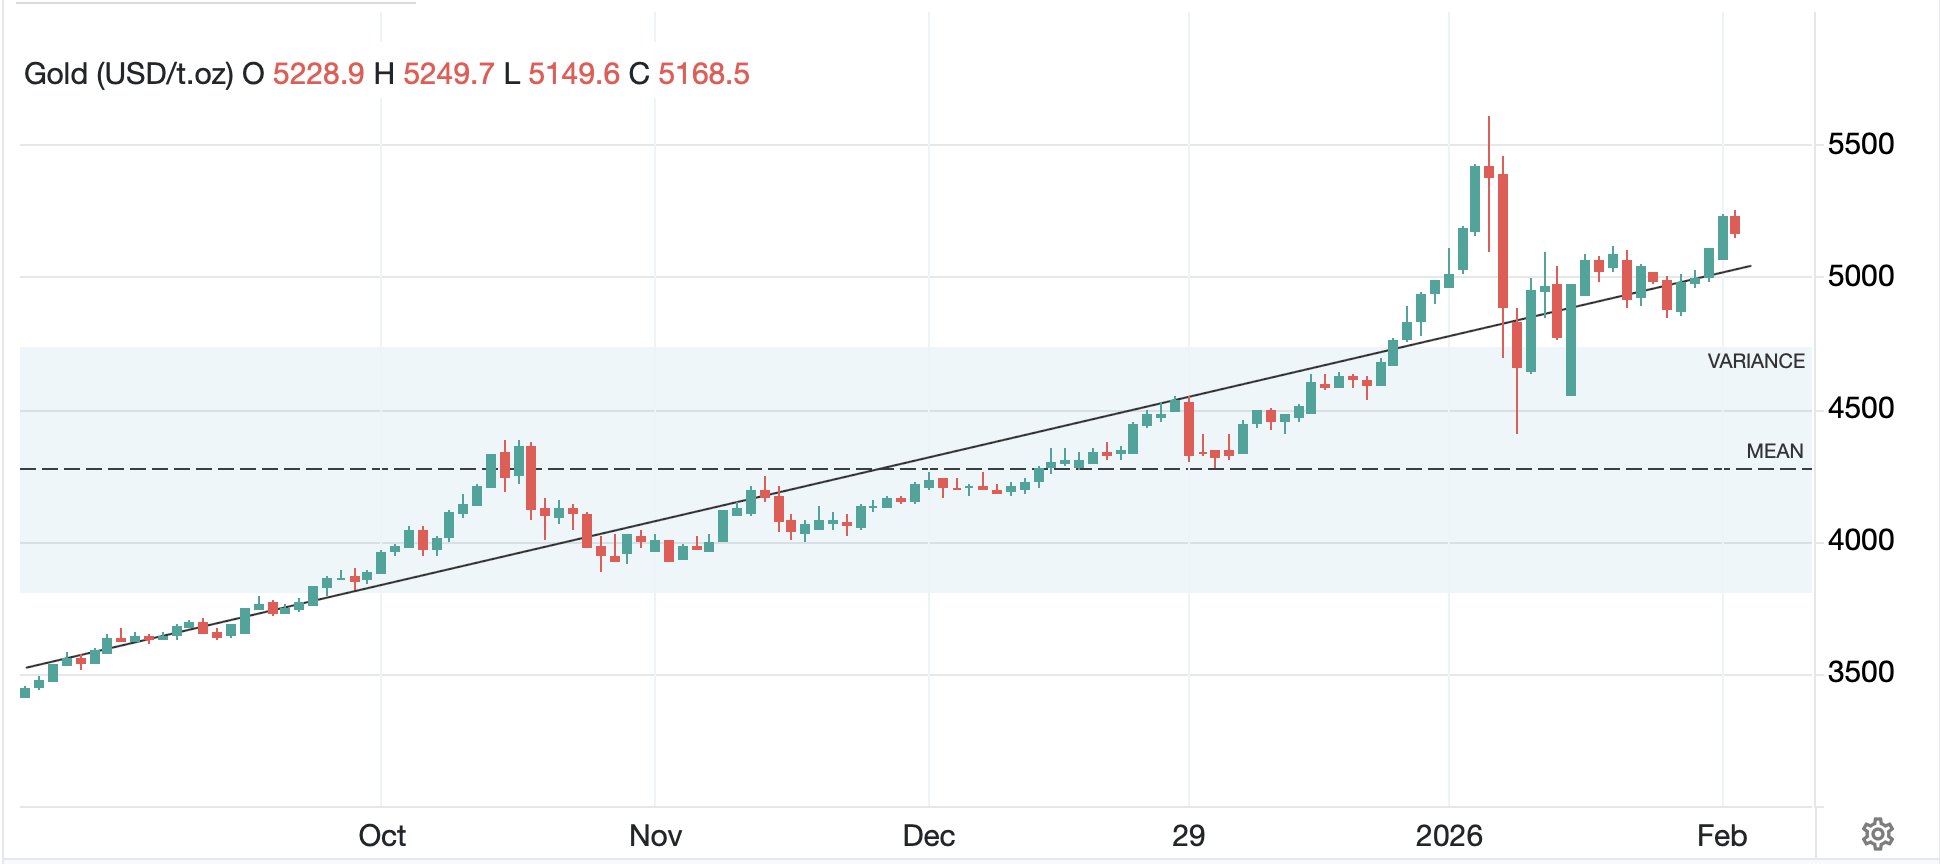
In the commodity markets, oil (+0.3%) continues to hold its recent Iran inspired gains as the world awaits the outcome of Friday’s meetings between the US and Iran. I have no insight as to the potential outcome here other than what I read, but it does seem like there will be some type of military action as I do not see Iran ceding anything. As to the precious metals, gold (-1.0%) is giving back yesterday’s gains but remains in its recent uptrend after the end-January crash, although it has yet to regain the old highs. I imagine this will take more time, but it also seems quite likely to happen. This is still a quite bullish chart in my view.
Source: tradingeconomics.com
Interestingly, silver is little changed this morning as there continues to be much talk of delivery questions at the COMEX given the apparent lack of available ounces relative to outstanding contracts. My take is things will get rolled as they usually do, but if not, beware a major spike higher on Friday!
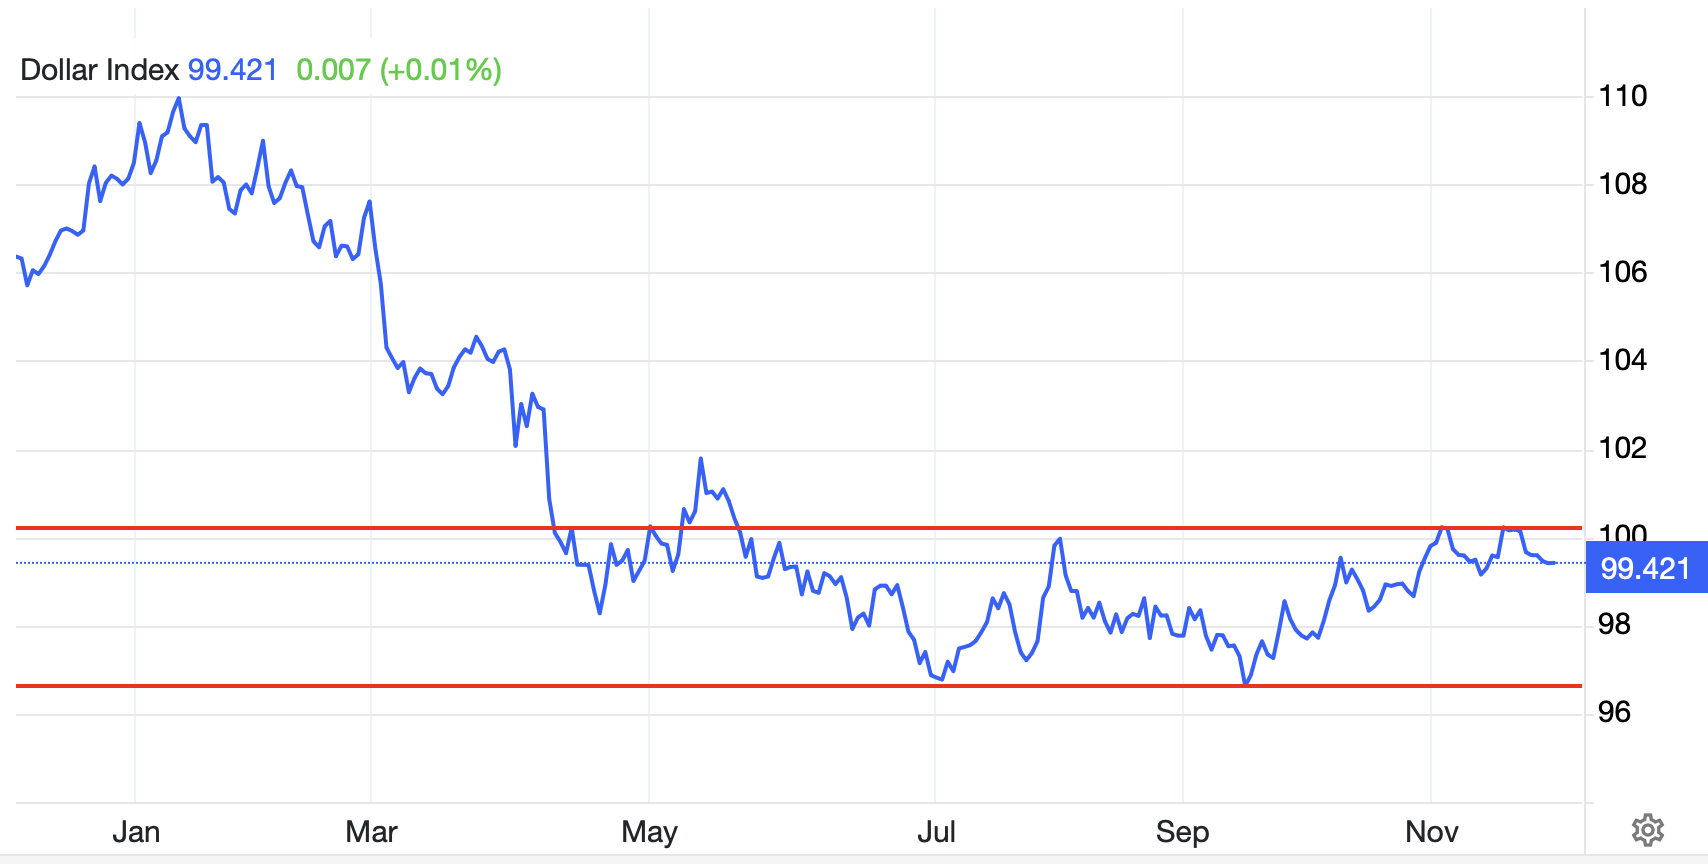
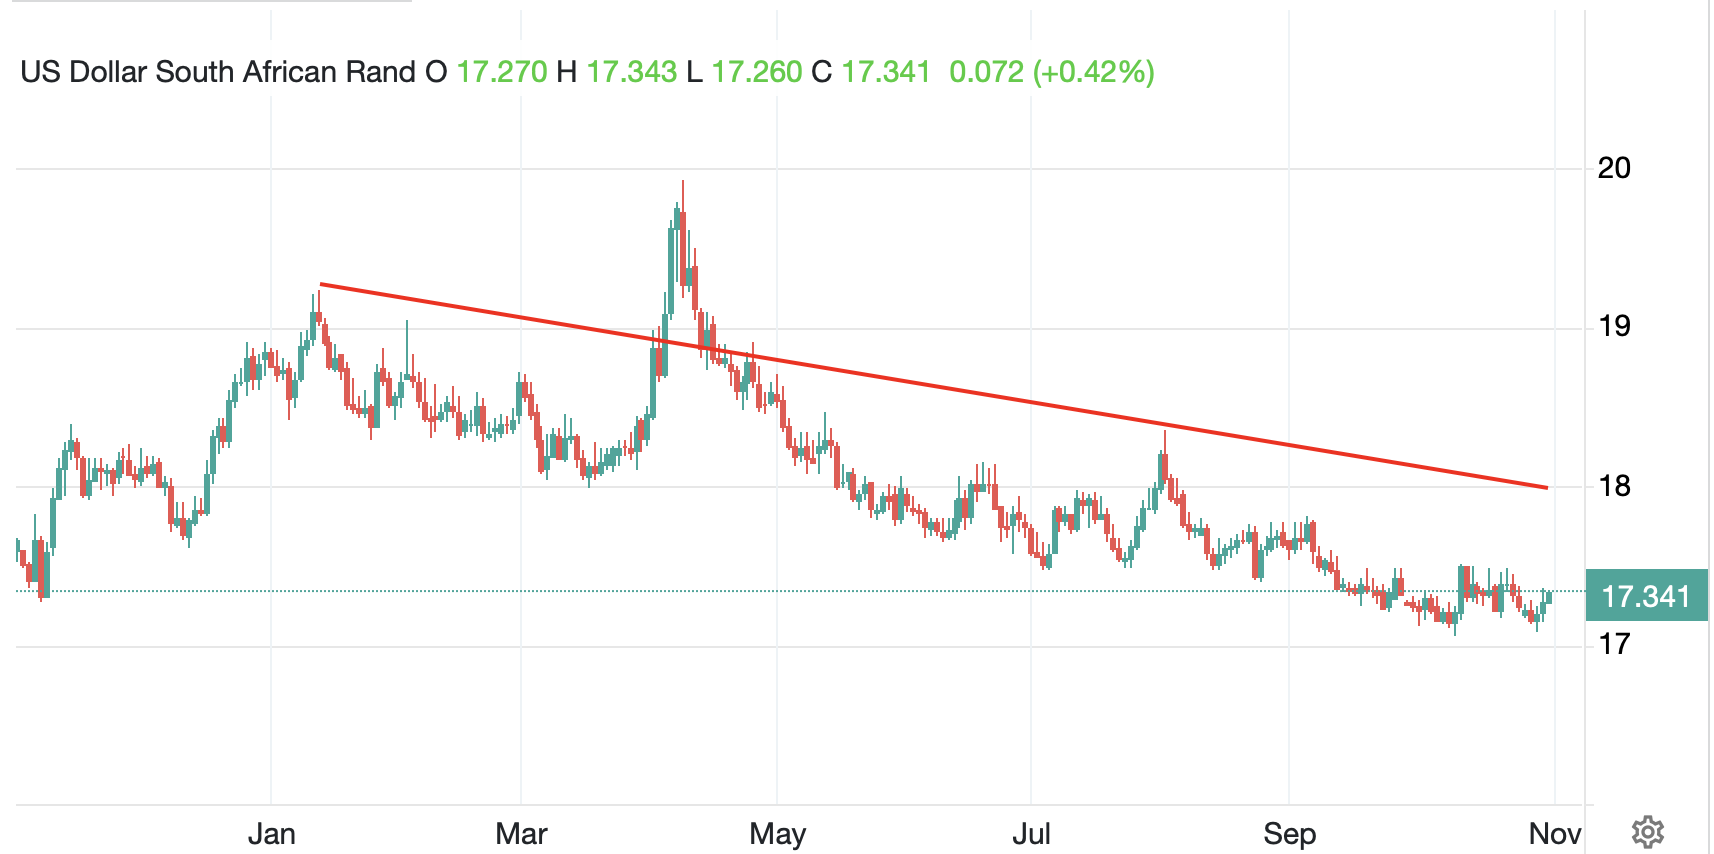
Finally, the dollar continues to be the least interesting space there is with today’s JPY (-0.8%) move the exception that proves the rule. Having already touched on that situation, there is literally nothing else to describe in either G10 or EMG currencies as +/-0.15% describes the entire session.
As to data this week, here’s what we have coming:
| Today | Case Shiller Home Prices | 1.4% |
| Consumer Confidence | 87.0 | |
| Thursday | Initial Claims | 216K |
| Continuing Claims | 1872K | |
| Friday | PPI | 0.3% (2.6% Y/Y) |
| -ex food & energy | 0.3% (3.0% Y/Y) | |
| Chicago PMI | 52.5 |
Source: tradingeconomics.com
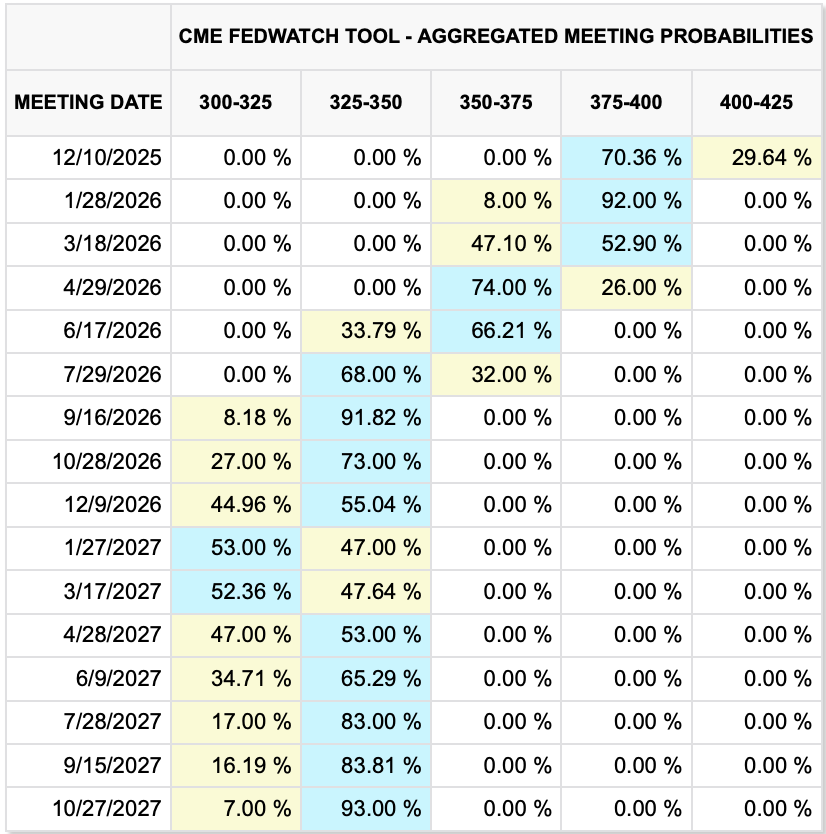
In addition to this bit, we hear from seven more Fed speakers across nine venues, but I still don’t think anybody cares. The market has priced out any rate cuts before Powell leaves, although there is still one cut priced for the year, expected in October.
Frankly, it is not surprising that markets have calmed down so much given how much activity we saw in January. As I wrote then, markets have a great deal of difficulty maintaining high volatility as traders and investors simply get tired and tune out. We will need a new catalyst to get things going, either an attack on Iran or some new China news in my view. Tariffs are no longer interesting, and frankly I think Iran and AI have both lost some pizzazz. Maybe the UFO releases will get things going again!
Good luck
Adf